
This article is only a personal trading study note and does not constitute investment advice. Trading involves risk. Make independent judgments and take responsibility for your own decisions.
ICT on Order Block: how to draw and apply Order Block - SMC
When learning SMC, Smart Money Concepts, Order Block is a very important concept. It helps traders observe the entry and exit of institutional capital and capture trading opportunities inside price movement more accurately. Next, Penchan will walk through Order Block in detail.
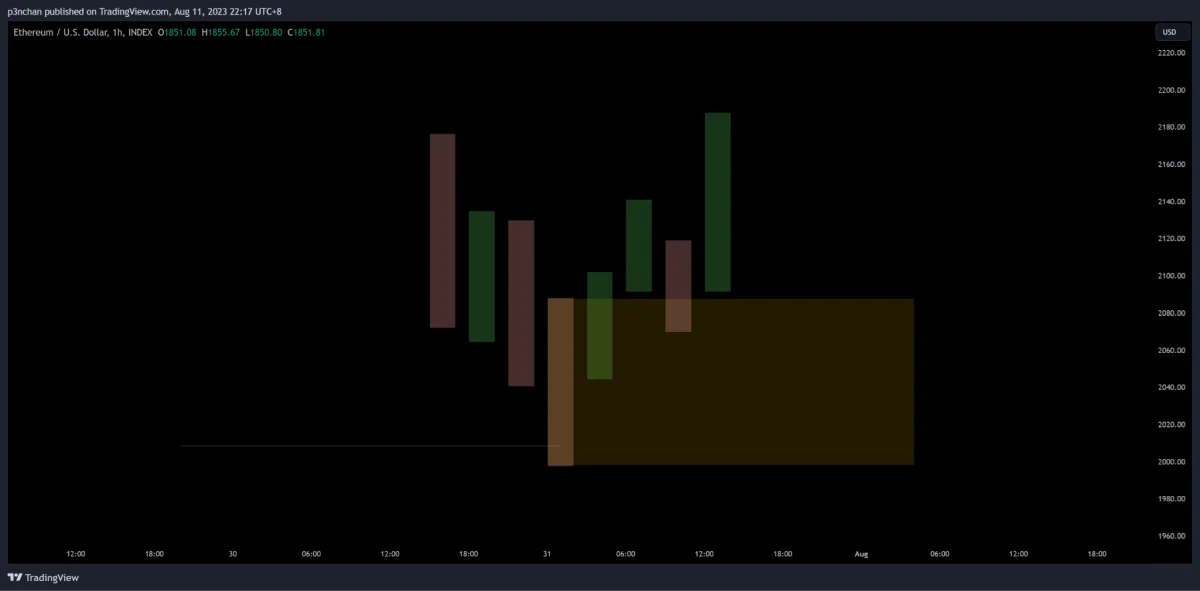
Figure 1. Order Block concept chart
An Order Block is formed by a specific candle. It can mark where Smart Money buys and sells. Compared with common supply and demand zones, Order Block provides clearer price information. Traders can even combine it with familiar technical-analysis techniques on lower timeframes to refine the Order Block.
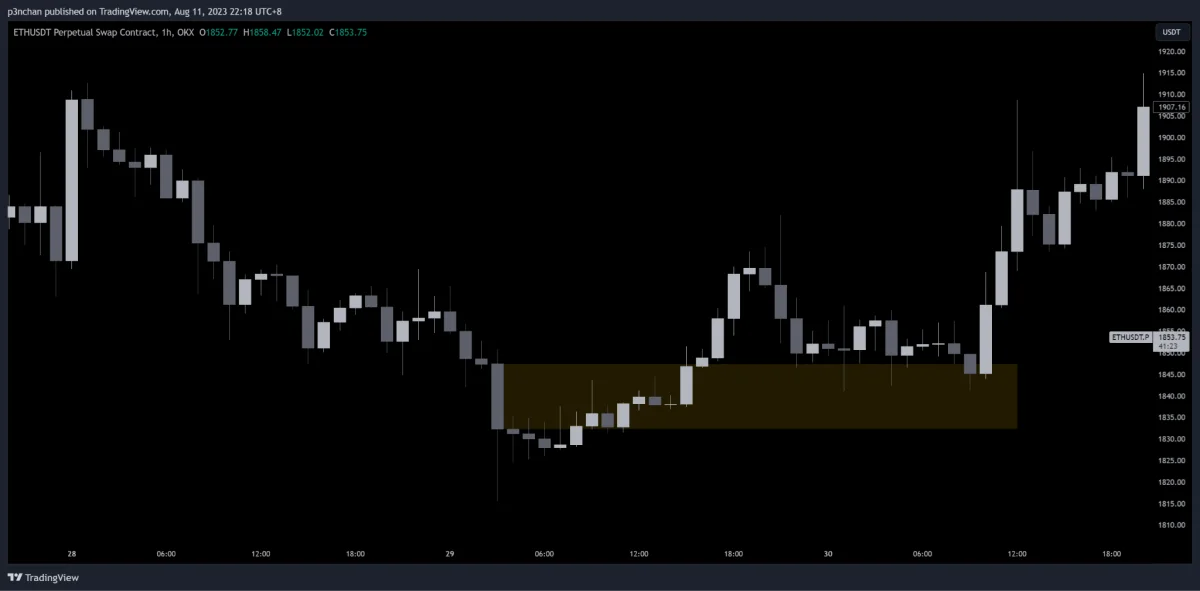
Figure 2. Order Block inside a trend
Bullish Order Block
By definition, the following conditions form a Bullish Order Block. The drawing range is from open to close, Open - Close.
Lowest candle
Bearish candle
Widest open-to-close body
Near a key support level [1]
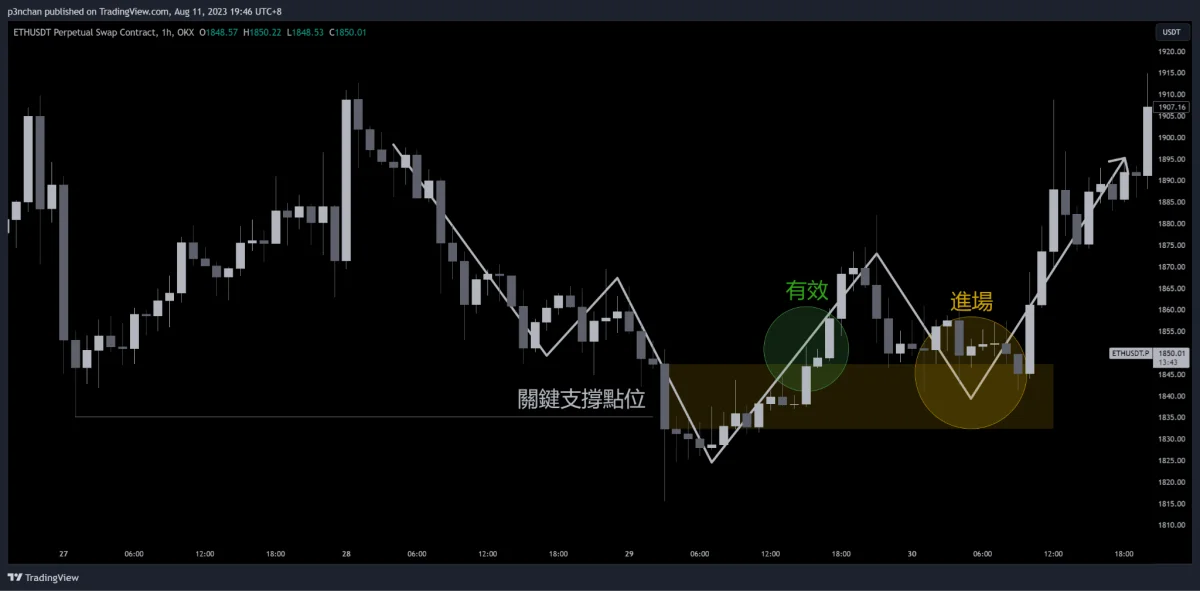
Figure 3. Bullish Order Block
After finding an Order Block, you need to wait for the highest price of that Order Block to be broken by a later candle before confirming its validity. Refer to Figure 2. After price leaves the high of the Order Block, a pullback into it can be treated as a potential entry-observation area.
Bearish Order Block
By definition, the following conditions form a Bearish Order Block. The drawing range is from open to close, Open - Close.
Highest candle
Bullish candle
Widest open-to-close body
Near a key resistance level [1]
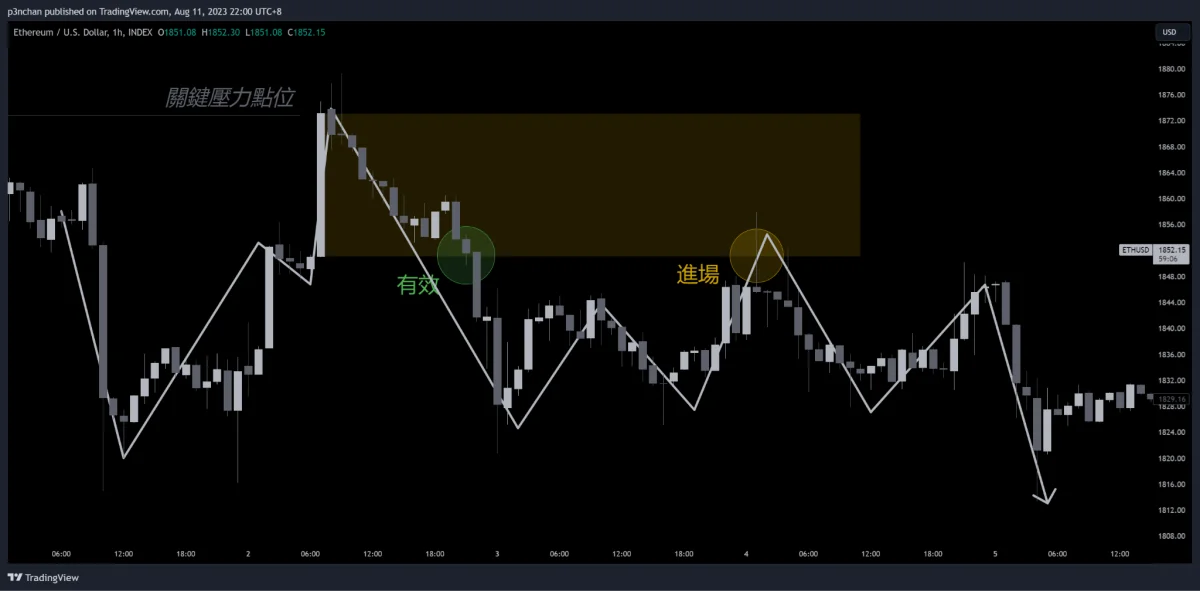
Figure 4. Bearish Order Block
After finding an Order Block, you need to wait for the lowest price of that Order Block to be broken by a later candle before confirming its validity. After price leaves the low of the Order Block, a pullback into it can be treated as a potential entry-observation area.
Simplified Order Block
A Bullish Order Block can be found as the final bearish candle before a move breaks a swing high. This is also the common way people search from MSB, Market Structure Break. You can also refer to reference [2] at the end. A Bearish Order Block can be found as the final bullish candle before a move breaks a swing low.
The simplified Order Block can also use the entire candle, meaning the full range from high to low.
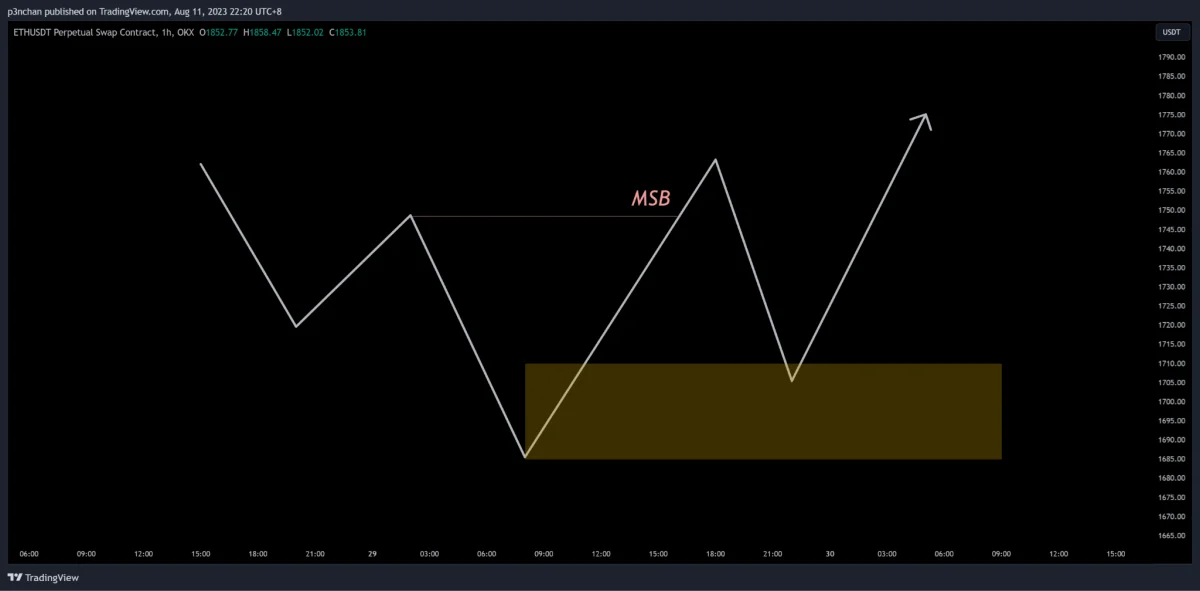
Figure 5. Simplified Order Block diagram
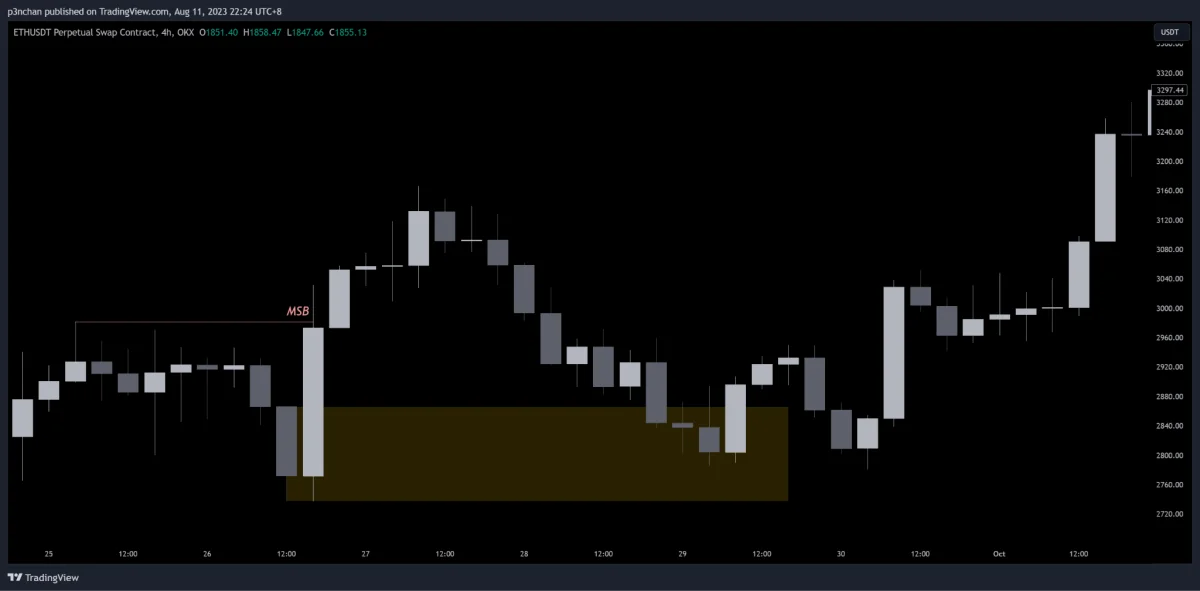
Figure 6. Simplified Order Block
Application and Trading Strategy
After understanding the definition, let’s look at how to choose and apply Order Block. First, remember that Order Block has clear definitions, but in practice people use it differently according to personal habits. Do not follow the rulebook blindly.
First, when we are considering opening a position, several price levels can be used as references. Using Bullish Order Block as the example, pay special attention to three key levels: the high of the Order Block, the candle open [3], and the midpoint of the Order Block. All three can be ideal Order Block entry levels. Traders can also use lower-timeframe refinement if needed.
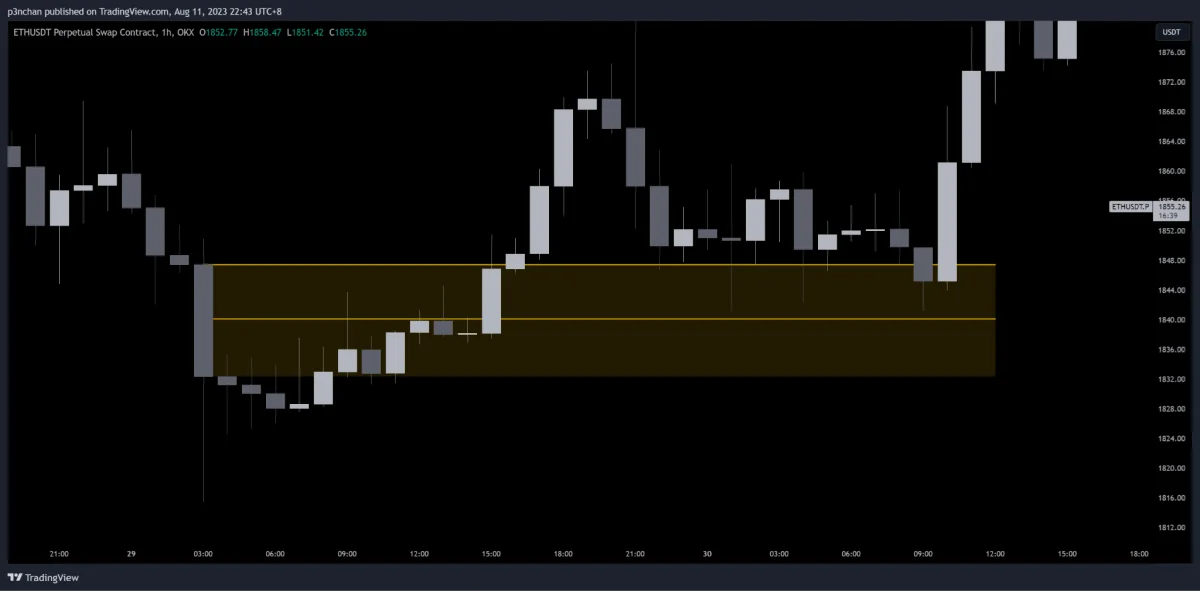
Figure 7. Reference entry levels
However, a trade is not only about entry timing. More importantly, we need to manage trading risk properly. For stop loss, traders can consider using the low of the Order Block as a relatively safe stop level. Also, once price leaves a Bullish Order Block, the lower half of the entire Order Block, the 50% area, can also be treated as a suitable stop-loss area.
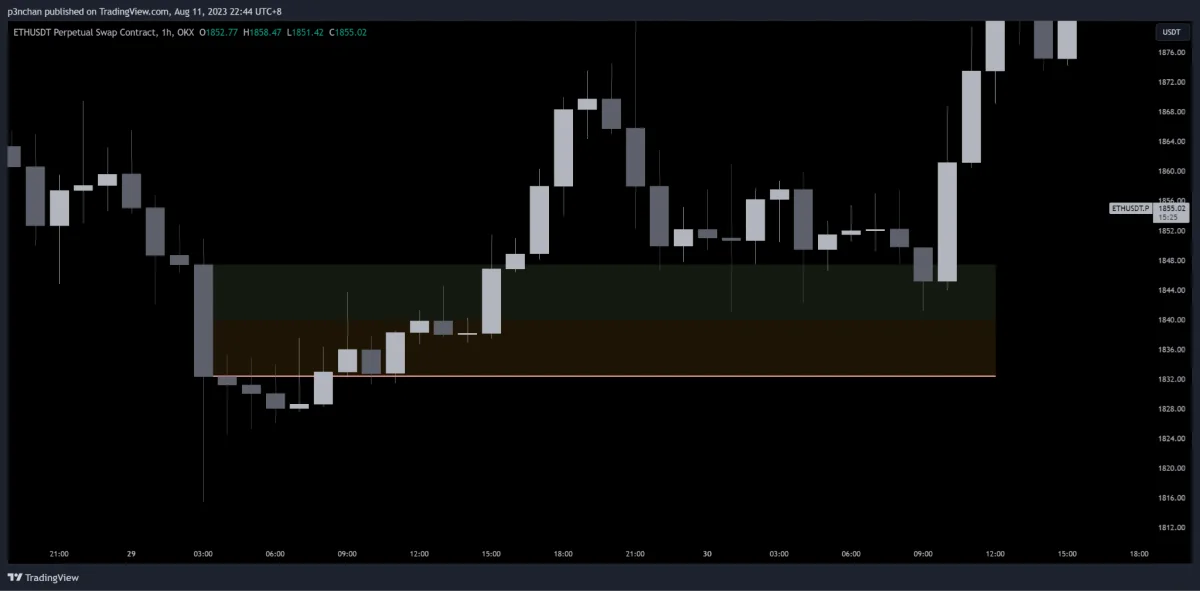
Figure 8. Reference stop-loss levels
For take profit, traders can try to find previous highs, meaning Liquidity Pools, and use them as take-profit targets. Other technical-analysis methods can also be paired for exits.
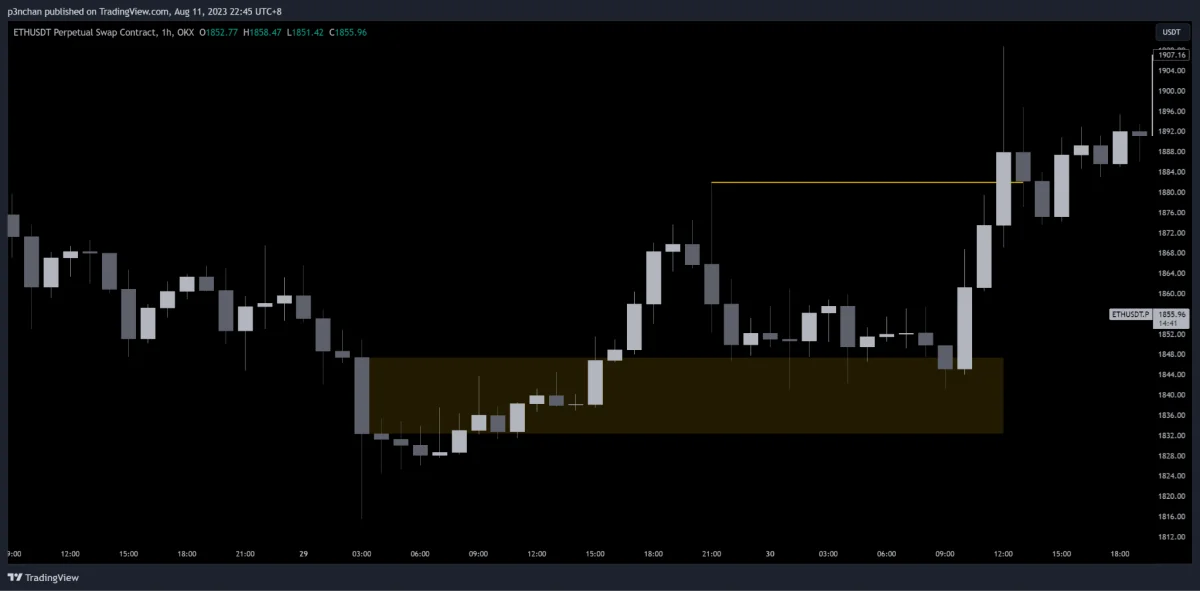
Figure 9. Reference take-profit level
Also, when price touches an Order Block, we need to watch how it changes at all times. Traders can mark the previous Order Block because sometimes when the current Order Block is broken, the previous Order Block may become a potential reversal point.
Ideally, when price enters an Order Block, it should not exceed the midpoint. In some cases, price may slightly exceed the midpoint, and that is still acceptable. But when price clearly retraces beyond 50% of the Order Block, we can consider this Order Block invalid and shift our focus to the previous Order Block or other price action.
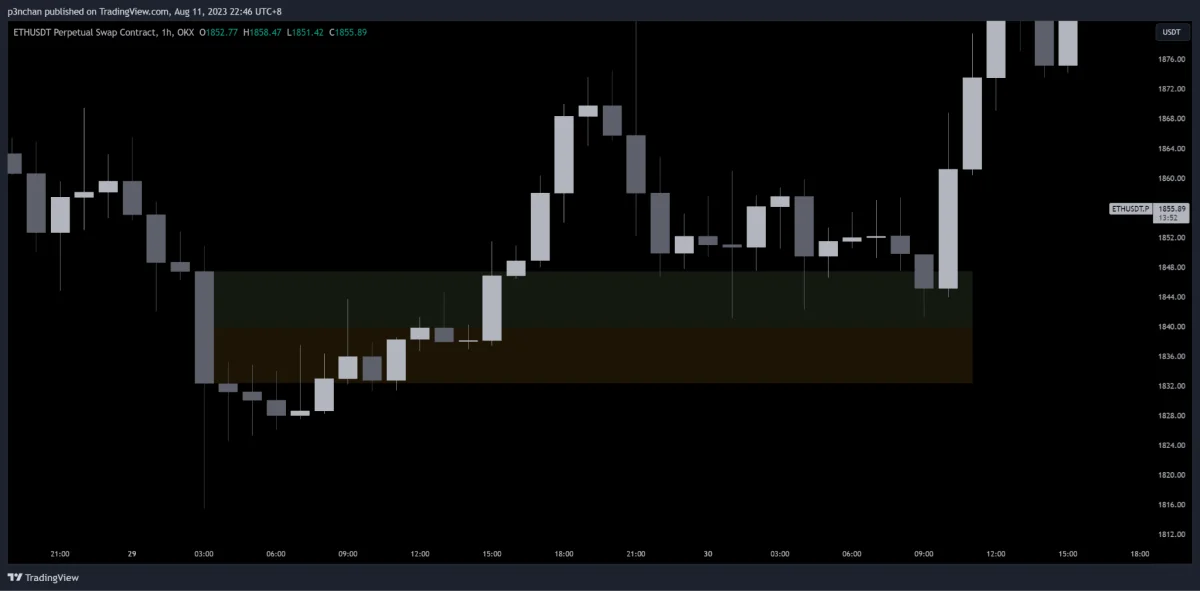
Figure 10. Splitting the Order Block by 50%
The examples above use Bullish Order Block. For Bearish Order Block, just reverse the logic. For simple graphics on Order Block, you can also visit reference [2] and find Penchan’s post.
Summary
Order Block is a key tool for traders reading institutional order flow. In general, institutions operate on higher timeframes such as monthly, weekly, and daily charts. They often prefer to use Order Block for positioning and trading. Although individual traders have limited capital, by understanding SMC and choosing and applying Order Block concepts accurately, everyone can more effectively follow large capital and improve the opportunity for profit.
Reference [1]: For how to find key levels, see “ICT on Support and Resistance: Natural Support and Resistance Across Multiple Timeframes” https://da.studio/archives/13108 .
Reference [2]: For the simplified Order Block method, see Penchan’s post “WHAT IS Order Block” https://www.instagram.com/p/ChHv1hNhcHq/ .
Reference [3]: In ICT’s definition, an Order Block is drawn from open to close. In the simplified version, however, the full candle range from high to low can be used. This method is also widely used, so it creates different Order Block highs and candle-open levels.