
This article is only a personal trading study note and does not constitute investment advice. Trading involves risk. Make independent judgments and take responsibility for your own decisions.
ICT on support and resistance: natural support and resistance across timeframes.
In trading markets, understanding support and resistance is extremely basic and important. This article discusses natural support and resistance created by different sessions and timeframes, and shows how to apply them in practice to improve trading skill.
Support and resistance are foundational trading concepts. Becoming familiar with them helps deepen your understanding of market behavior. In simple terms, support refers to a price zone where buying strength may increase when price falls into it, giving price a chance to stop falling and rebound. Conversely, resistance is a price zone where selling strength may increase when price rises into it, giving price a chance to stop rising and pull back.
Natural Support and Resistance
When analyzing support and resistance, we choose the highs and lows from specific time periods as references for future market behavior. Based on different time scopes, we can mark important support and resistance levels:
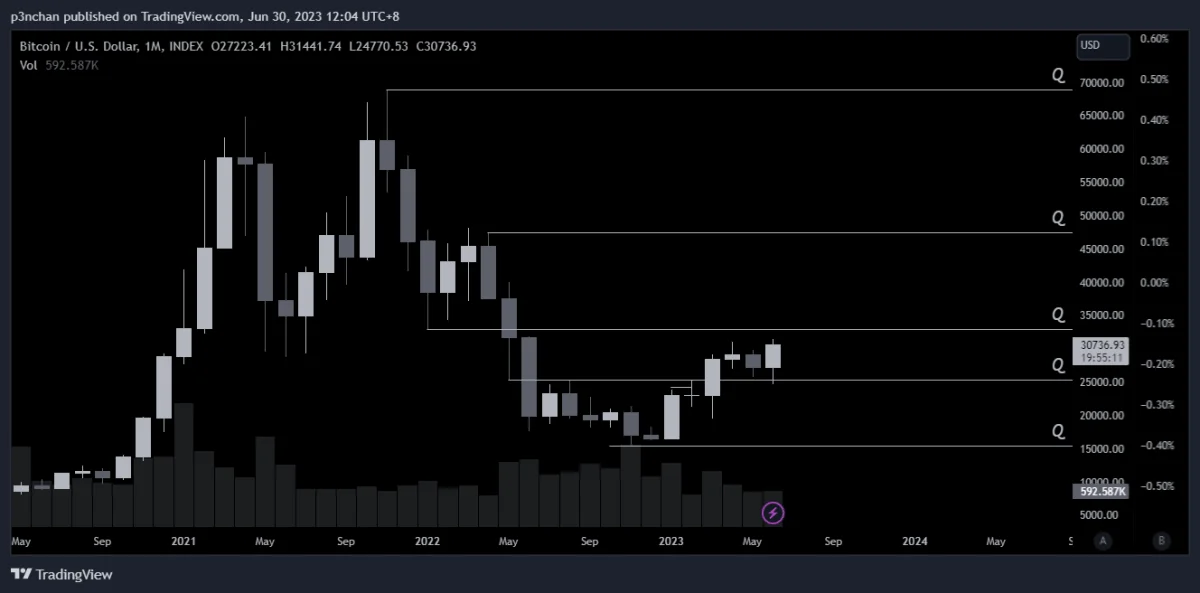
12-month highs and lows, the range of 12 months: mark the highest and lowest points of the year. When price touches these levels, we need to pay close attention to how price changes.
Quarterly highs and lows, the range of 3 months: each quarter’s high and low are also important reference points. When price touches them, observe price movement closely.
Monthly highs and lows, the range of 4 weeks: each month’s high and low also deserve attention, especially levels that repeatedly act as support or resistance.
Weekly highs and lows, the range of 1 week: further refining the view, we can mark each week’s high and low as observation points.
Daily highs and lows, the range of 24 hours: mark key support and resistance from the past three days. The previous day’s high may become today’s low. If price reaches these levels near the London or New York open, we can combine other technical analysis to plan trades.
Session highs and lows, Asia, London, and New York:
Asia session, after the London session:
Starts at 8:00, UTC+8
Ends at 17:00, UTC+8
Tolerance of plus or minus one hour
London session, after the New York session:
Starts at 16:00, UTC+8
Ends at 1:00, UTC+8
Tolerance of plus or minus one hour
New York session:
Starts at 21:00, UTC+8
Ends at 6:00, UTC+8
Tolerance of plus or minus one hour
Intraday trading: watch how swing legs touch these prices, especially when they retest the previous session’s high or low. These levels can serve as entries and exits, with relatively lower risk. For intraday trading, the 15-minute chart can be used as the main execution timeframe.
Live Example 1: Monthly and Quarterly Working Together
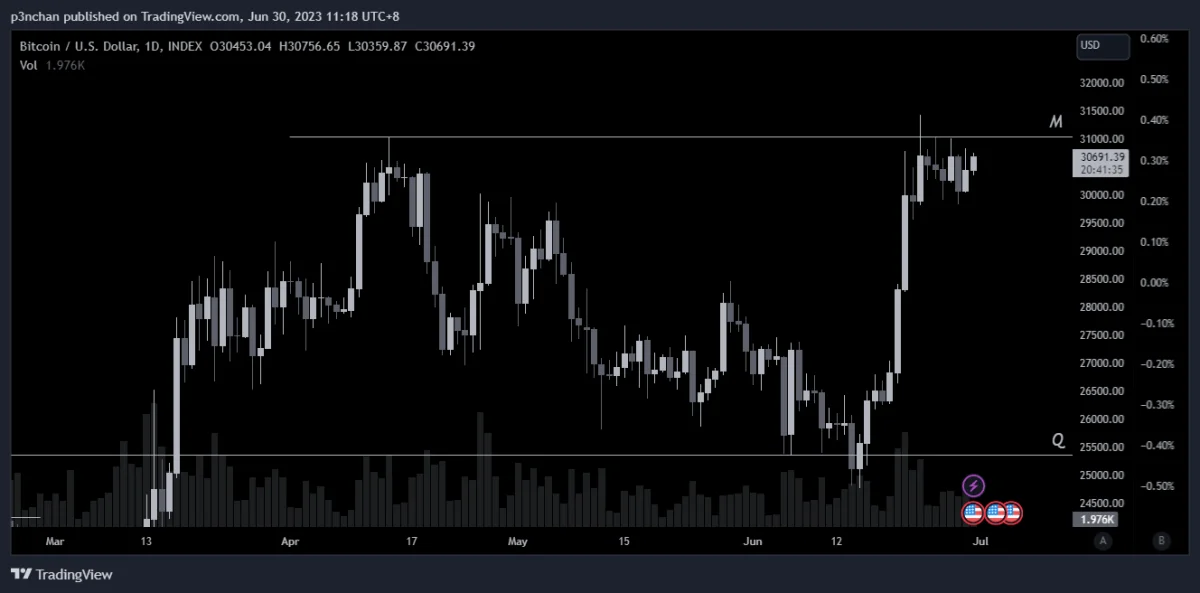
Figure 1. Monthly and quarterly highs and lows.
In Figure 1, the monthly high above becomes an important resistance area. After price breaks above it and then returns below, this may be stop sweeping. On the daily chart, if MSS appears afterward, it can combine with other analysis to form a bearish view.
The quarterly low below also forms important support. The day after price breaks support, it recovers, showing the same stop-sweeping behavior as above. In this situation, we can infer that bulls may have motivation to enter.
One reminder: stop sweeping does not necessarily create a trend reversal. Without enough experience, it is only a condition that may create reversal potential. I do not recommend building a left-side view from that alone. For most beginners, trading with the trend is still more likely to improve win rate and confidence.
Live Example 2: Trading a Short-Term Range
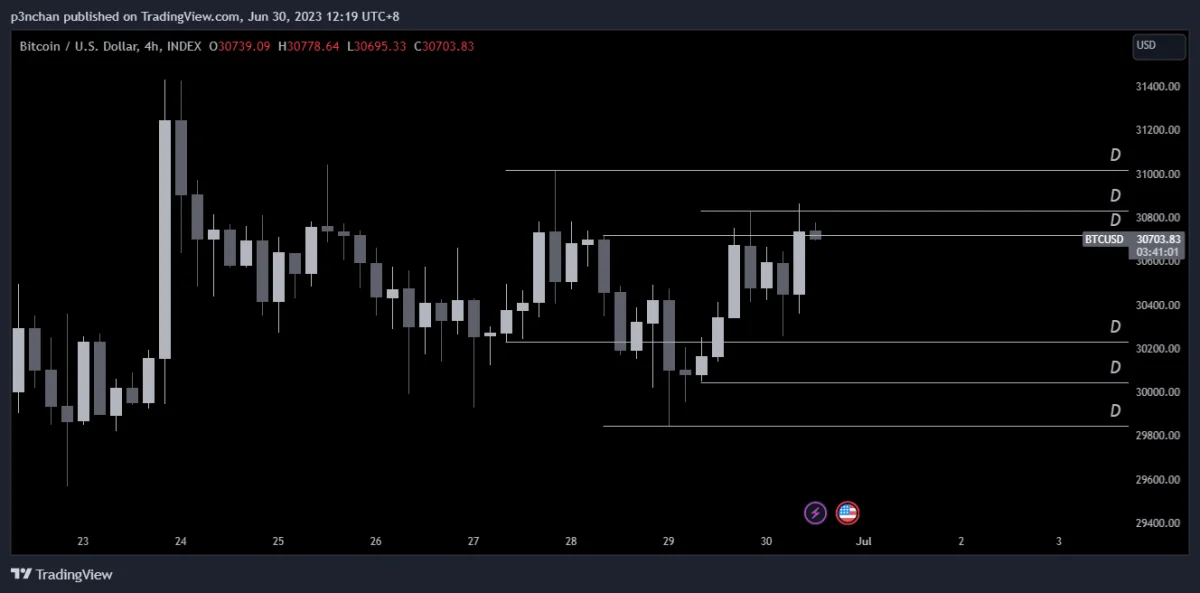
Figure 2. Daily and 4-hour charts are ranging, with the previous three days’ key levels marked.
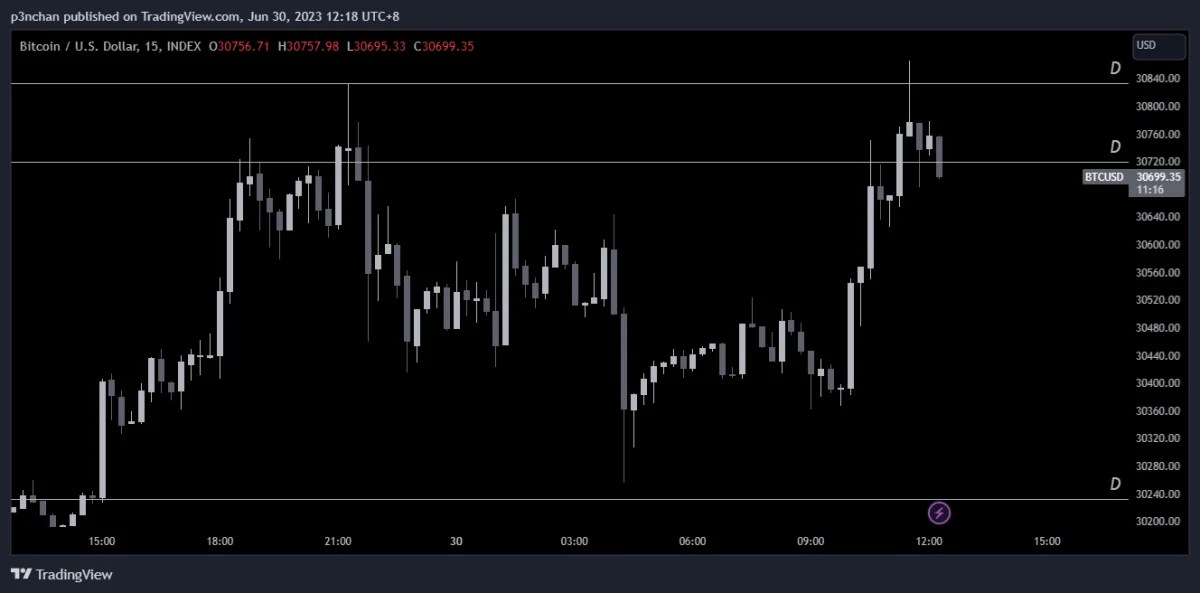
Figure 3. Switch to the 15-minute chart as the main execution timeframe.
In Figure 2, after switching to the daily timeframe, mark the highs and lows of the previous three days as future reference prices. When reading this type of price action, watch how price behaves around those levels. For example, after a rally, if the close cannot break through a key support/resistance level, an early bearish view may form. After combining it with trend reading from price action, if conditions are suitable, related trades can be planned. In Figure 3, after a structural change occurs, the OB concept can be used as a short reference area.
Summary
Drawing and reading support and resistance across multiple timeframes is very important for later market movement. This article mentioned a few basic drawing methods and key points. There are many further applications, such as how higher timeframes interact with Liquidity-taking price action on lower timeframes. Those can be added in the future.
Here, Penchan also encourages everyone to review charts often. Review helps you understand the market’s condition more deeply. Once you develop market feel, you will have more confidence in your strategy when facing more complex situations.