
This article is only a personal trading study note and does not constitute investment advice. Trading involves risk. Make independent judgments and take responsibility for your own decisions.
ICT on Liquidity Pool: the definition of Liquidity, orders, and how Liquidity Pools interact with the market - SMC
In today’s trading markets, Liquidity Pools and related trading strategies give us a useful window into institutional algorithms. In this article, Penchan will walk through Liquidity and Liquidity Pools, then use them to help us better understand the meaning behind the chart.
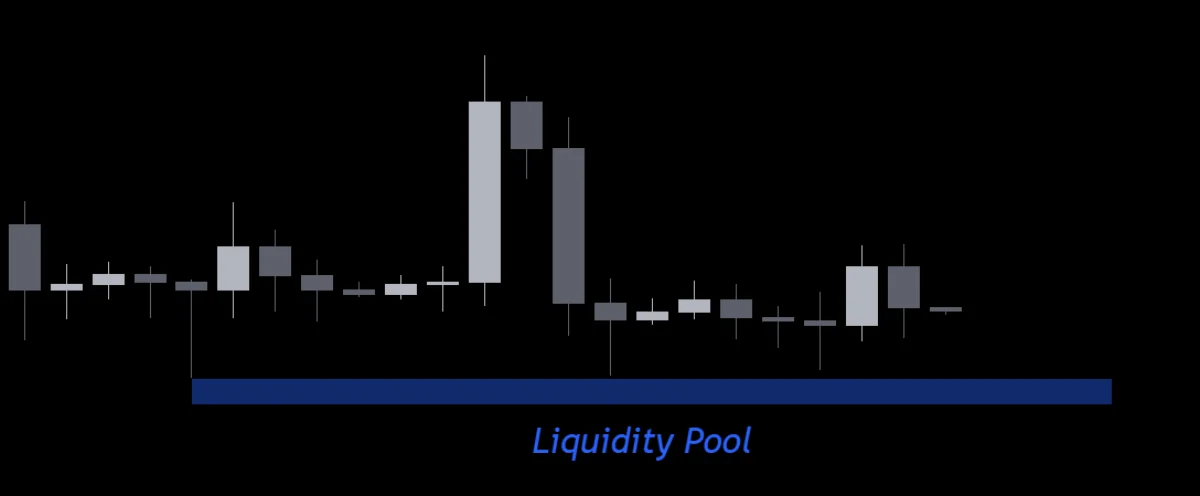
Figure 1. Liquidity Pool
In financial markets, Liquidity means “how easily an asset can be bought or sold without affecting its price” [1]. For example, if you buy Bitcoin with 10,000 USDT on a large exchange, and also buy a small coin that has not yet listed on major exchanges with the same amount, the price impact on Bitcoin from that 10,000 USDT will be far smaller than the impact on that small coin.
So in general, we describe larger markets or well-known assets as having “higher Liquidity.” Examples include the U.S. stock market, Bitcoin, and Ethereum. In contrast, smaller markets, less-known assets, or highly volatile assets usually have “lower Liquidity,” such as certain small coins listed only on decentralized markets, NFT assets, or real estate.
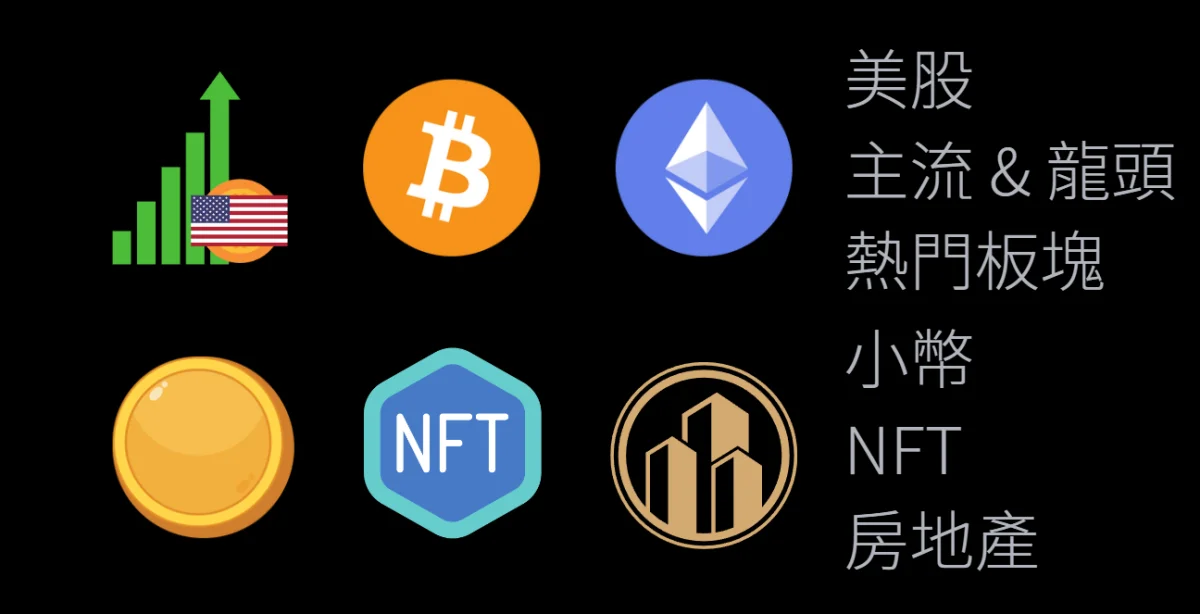
Figure 2. Examples of high-Liquidity and low-Liquidity assets
In practical trading, Liquidity can also be understood simply as “unfilled orders.”
The Relationship Between Orders and Liquidity
Orders can mainly be divided into market orders, limit orders, and conditional orders.
In an order book, each price level has a quantity beside it, showing the number of orders resting at that price. These resting quantities come from traders expressing buy and sell interest through limit orders. Once those orders are placed, they provide Liquidity to the market.
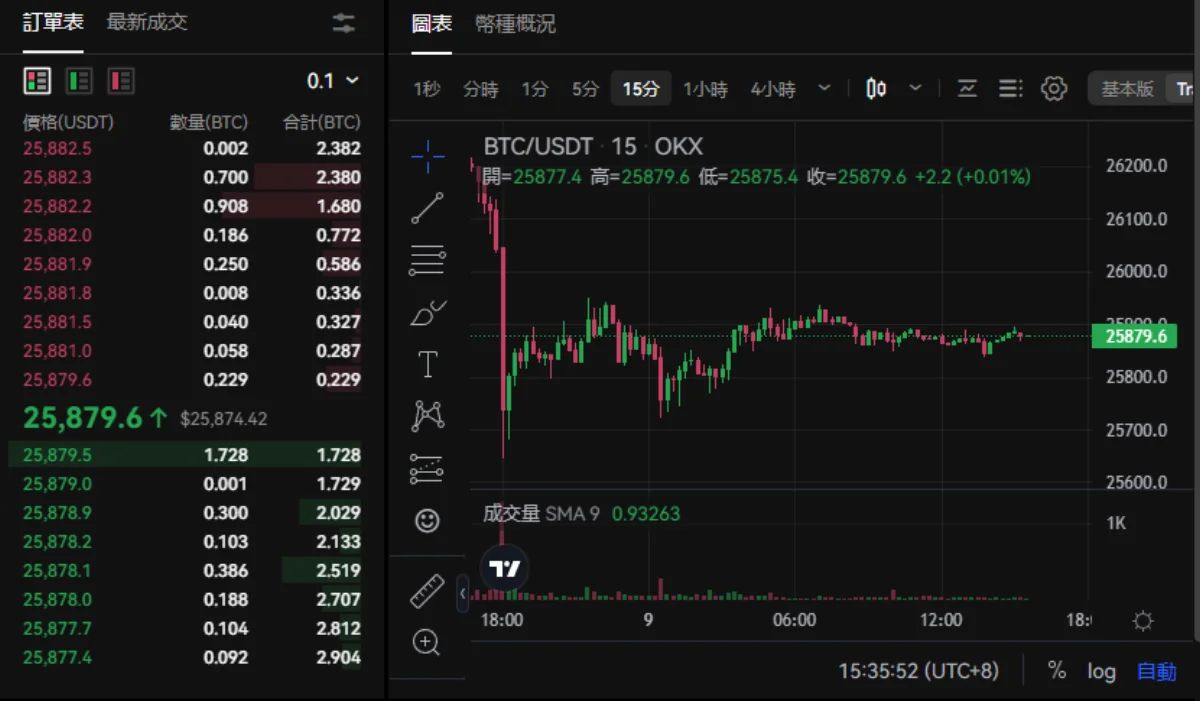
Figure 3. OKX exchange order book and price chart.
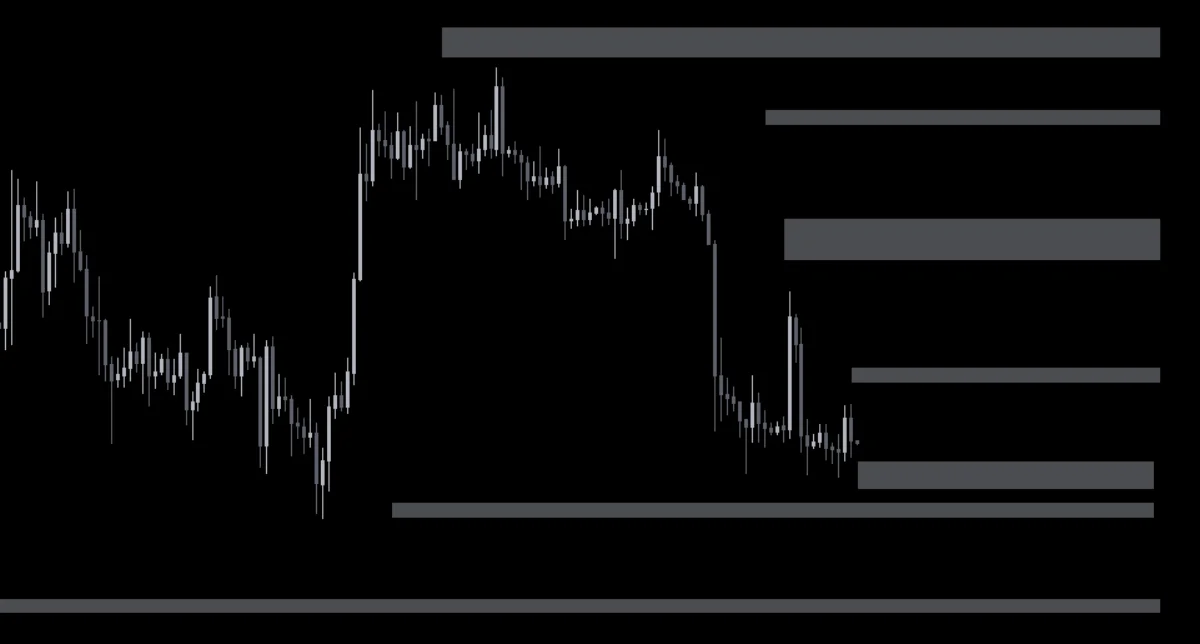
Figure 4. Limit orders exist above and below the current price
By contrast, a market order is used to consume those resting orders. This creates movement in market price, meaning the formation of candles and the rise and fall of price. A conditional order enters the market to provide or consume Liquidity only after its preset condition is met. This is just a brief introduction here. If there is a chance later, we can write a more detailed explanation of orders [2].
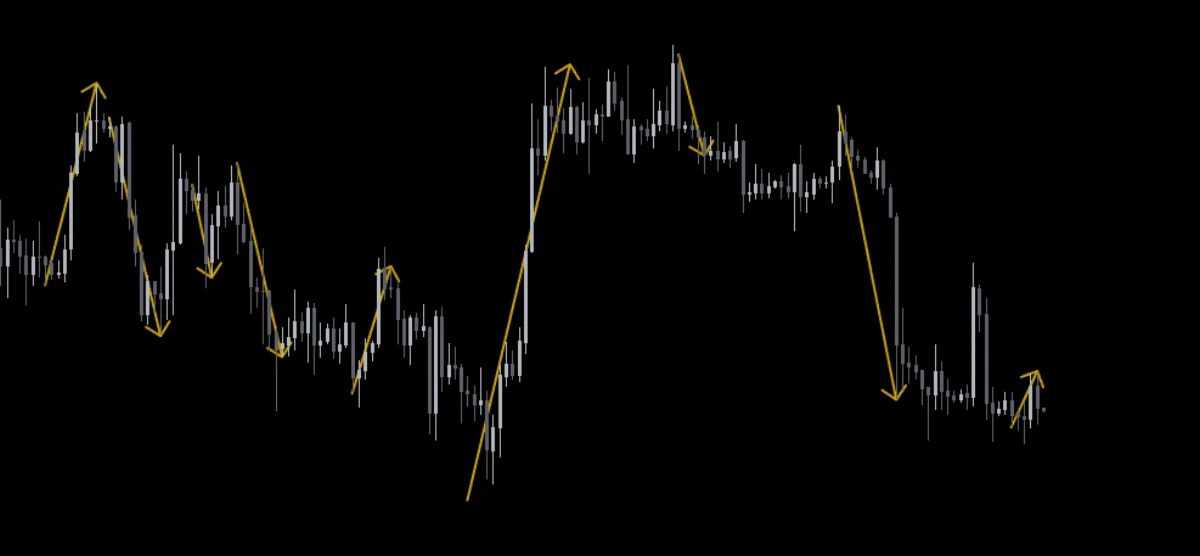
Figure 5. Market orders are used to drive the market up and down
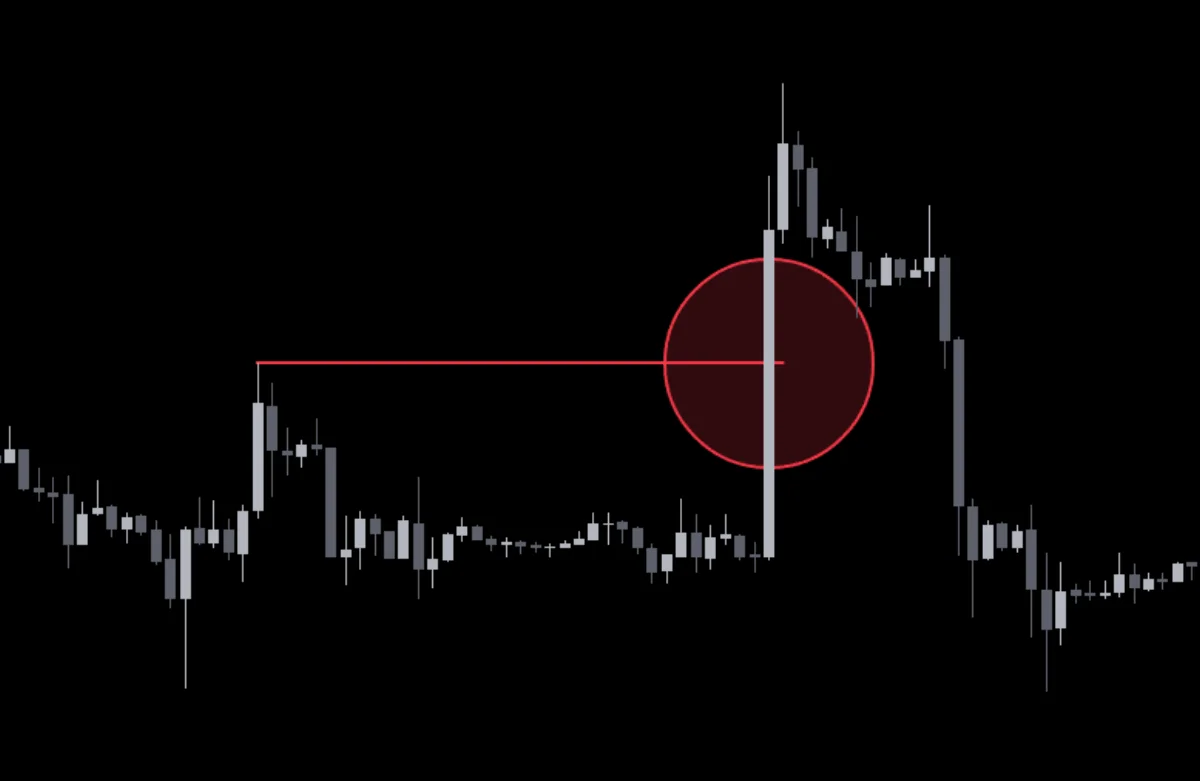
Figure 6. Conditional orders execute an order strategy only after a specific condition is met, whether market or limit
In higher-Liquidity markets or sessions, such as the European and U.S. sessions in FX, we can observe more order executions, which increases volume. In lower-Liquidity markets or sessions, price may move violently or even gap. That is unfavorable for institutions. To obtain Liquidity, institutions may attack a Liquidity Pool and use it to access more capital.
ICT on Liquidity Pool
A Liquidity Pool refers to a price level where many unfilled orders exist. Liquidity Pools appear around previous lows and previous highs. Equal highs and equal lows are especially good Liquidity Pools. Some schools also use trendlines as Liquidity Pools.
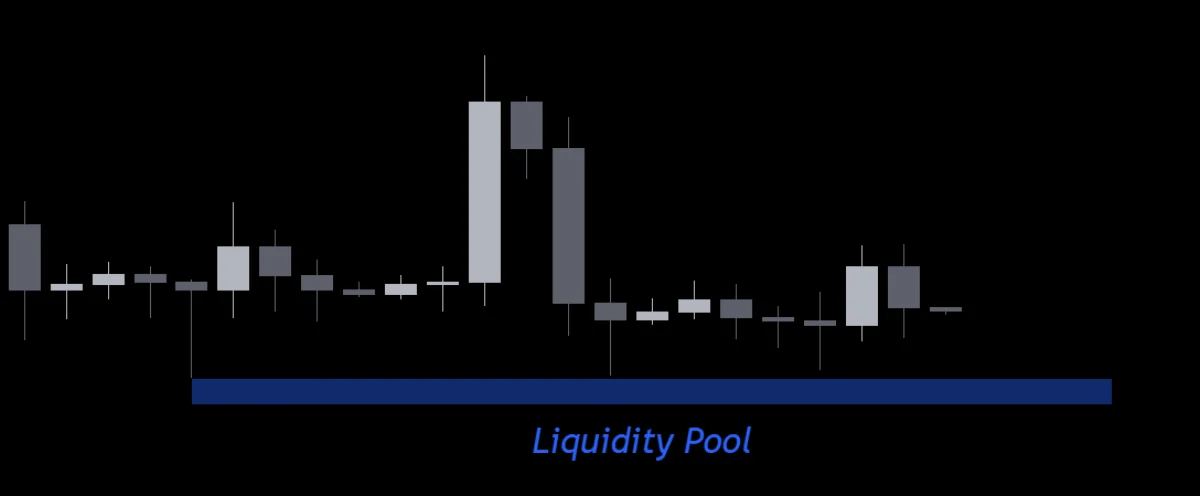
Figure 7. Liquidity Pool formed by equal lows
Smart Money uses algorithms to draw equal highs, equal lows, trendlines, and similar features, making retail traders believe those prices are affected by support, resistance, or trendlines. Then they use false breakdowns or false breakouts to match their own orders with retail stop-loss and breakout orders, allowing them to obtain lower-cost orders. The important point is that the direction of that breakdown or breakout does not continue.
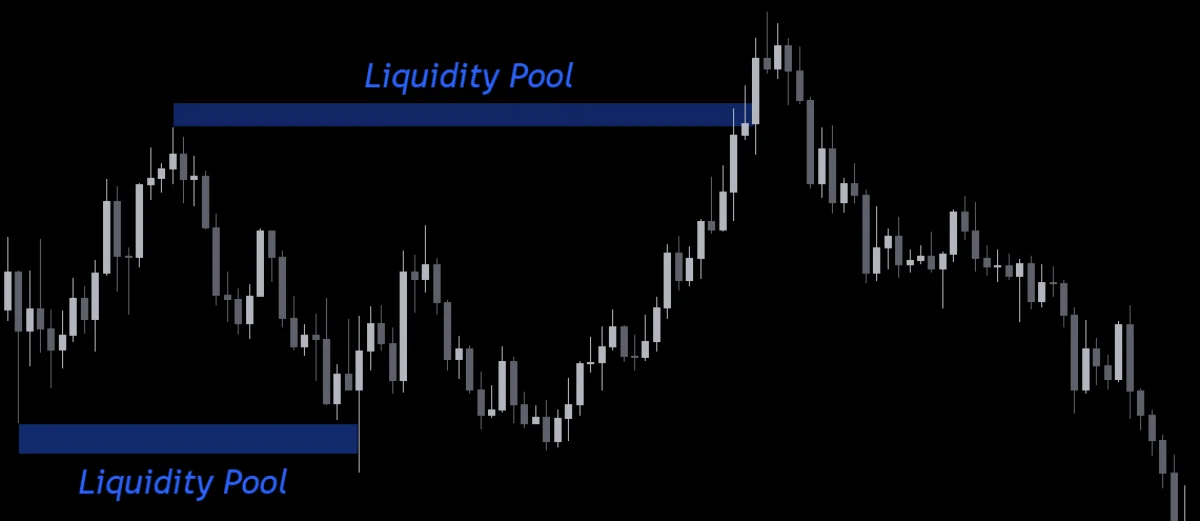
Figure 8. Major players attack Liquidity Pools to obtain more capital, then push the later direction for profit
When we observe the market, we should try to identify where Liquidity Pools may exist. For example, when going long, previous lows may hide Liquidity Pools and become targets for attack. When going short, previous highs may hide Liquidity and become targets for attack.
Applying the Liquidity Pool concept can lead to many trading strategies. Examples include range trading, identifying false breakdowns or false breakouts through sweeping / Stop Hunt behavior, and broad Power of Three, PO3, setups where a stop-loss break below a key level is reclaimed. Later, you can learn more instructors’ trading strategies inside the DA Traders Union group.
Reference [1]: Graphic explanation “Liquidity” https://www.instagram.com/p/CdBc-JDpGri/
Reference [2]: Graphic explanations “Limit Order” https://www.instagram.com/p/CdLnwdGpGxL/ , “Market Order” https://www.instagram.com/p/CdI3mbMJWCv/ , “Conditional Order” https://www.instagram.com/p/CdOT6c2Jej_/