
This article is only a personal trading study note and does not constitute investment advice. Trading involves risk. Make independent judgments and take responsibility for your own decisions.
ICT on support and resistance: Fibonacci retracement, extension, and when to use them.
As traders, we are all looking for better ways to maximize profit. Fibonacci plays a key role in that process. Inside SMC, Fibonacci is not the most important tool, but because the market forms consensus around these levels, they often receive respect. That is not something we can ignore. Below, we will walk through the relationship between Fibonacci and support/resistance, and use it as an entry point into this topic.
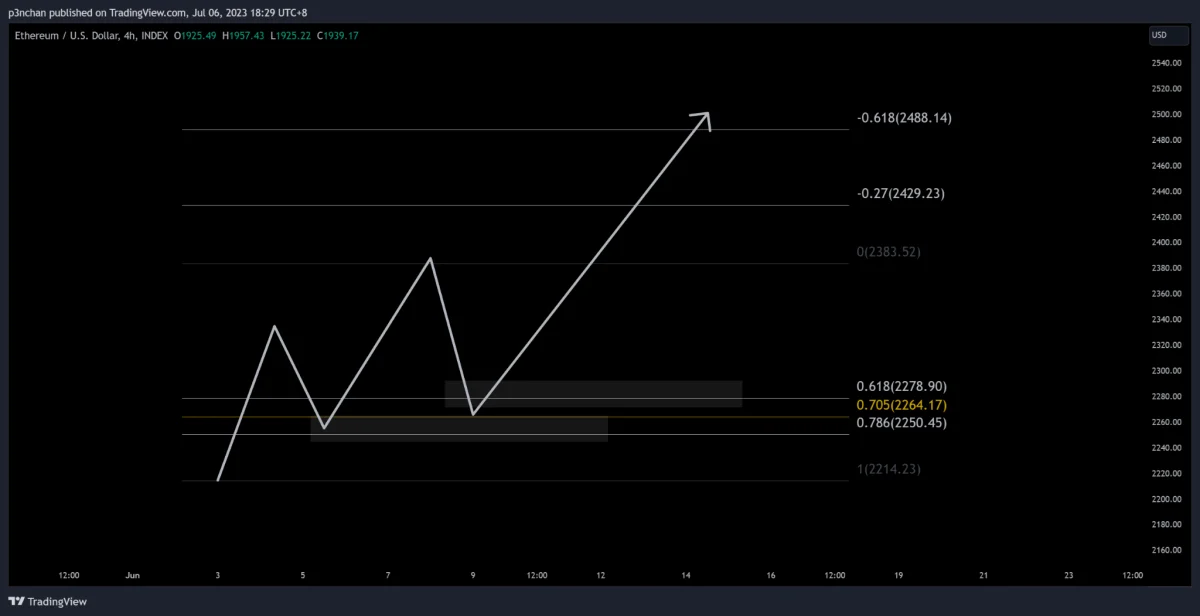
Traders often use Fibonacci retracement levels as potential support and resistance areas. These levels work partly because many traders pay attention to them. That shared attention turns them into something close to a self-fulfilling prophecy.
Fibonacci Extension
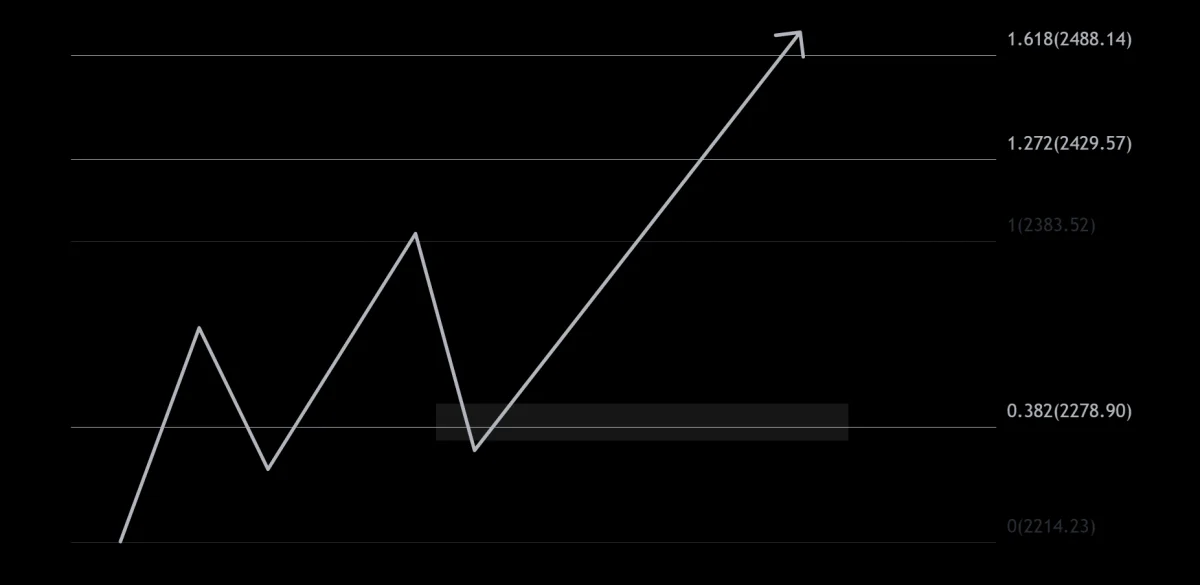
Traders often use Fibonacci extension levels as take-profit, TP, prices. The logic is the same as above: when traders watch these levels, they choose to sell or buy around them, and the extension levels become part of the market’s shared reference points.
Common Fibonacci Retracement Levels
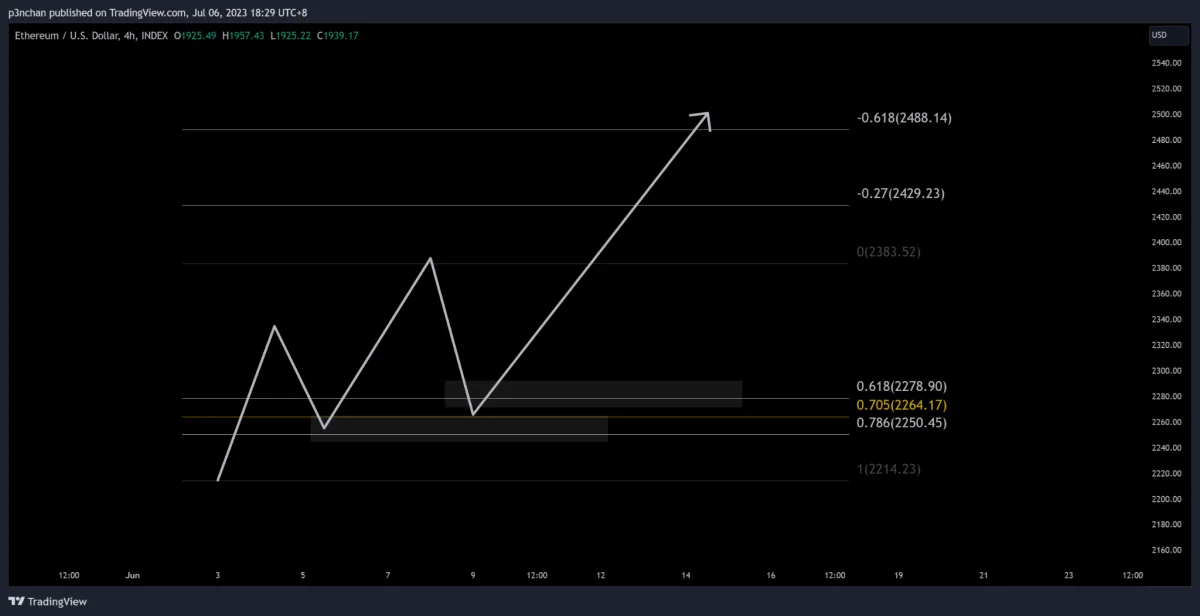
0: first take profit, taking profit
0.5: equilibrium point. If price is ranging, it may sometimes act as support or resistance.
0.618: 62%
0.705: OTE optimal trade entry point
0.786: 79%
1: 100%
-0.272: TP1
-0.618: TP2
The direction opposite to Fibonacci retracement forms Fibonacci extension. The two have different purposes, but they can essentially be switched depending on how a trader likes to use the tool.
When to Use the Fibonacci Tool
The best time to use the Fibonacci tool is when the market is trending. For example, when the market is in an uptrend, you can look for long entries, or buys, at support prices formed by Fibonacci retracement levels. When the market is in a downtrend, you can look for shorts, or sells, at resistance prices formed by Fibonacci retracement levels.
To find those retracement levels, you first need to identify recent key swing highs and swing lows. For this part, see DA Studio’s article “ICT on Support and Resistance: Natural Support and Resistance Across Multiple Timeframes.” A simple way to use Fibonacci is this: in an uptrend, connect the key lows to the most recent key high; in a downtrend, connect the key lows to the most recent key high.
If you include the concept of sessions, the highs and lows of the previous three daily candles, or highs and lows from different time zones, can also be used as Fibonacci reference highs and lows.
When using Fibonacci for projection, you also need to consider the market environment. The simplest example: in a bull market, we may use a 0.618 retracement to project a move toward 1.618. In a bear market, the situation is different. For this part, you can refer to DA’s other instructors and their weekly reports on Fibonacci.
Summary
Overall, Fibonacci retracement and extension are useful tools in a trading strategy. To use them correctly, you need a clear market trend, key highs and lows, and multi-timeframe natural support/resistance analysis. With that approach, we can find better entry points and take-profit prices. But remember: Fibonacci is only a useful tool. It cannot be the only decision standard. Traders still need a primary trading method to pair with it if they want better odds of consistency.
Here, Penchan also encourages everyone to review charts often. Review helps you understand what the market was doing. Once you build enough chart feel, you will have more confidence holding your strategy when the situation becomes more complex.