
This article is only a personal trading study note and does not constitute investment advice. Trading involves risk. Make independent judgments and take responsibility for your own decisions.
ICT on Trinity: the three-in-one and the art of three.
In ICT theory, one special number keeps appearing: three. ICT proposes a theory called Trinity, which revolves around the number three.
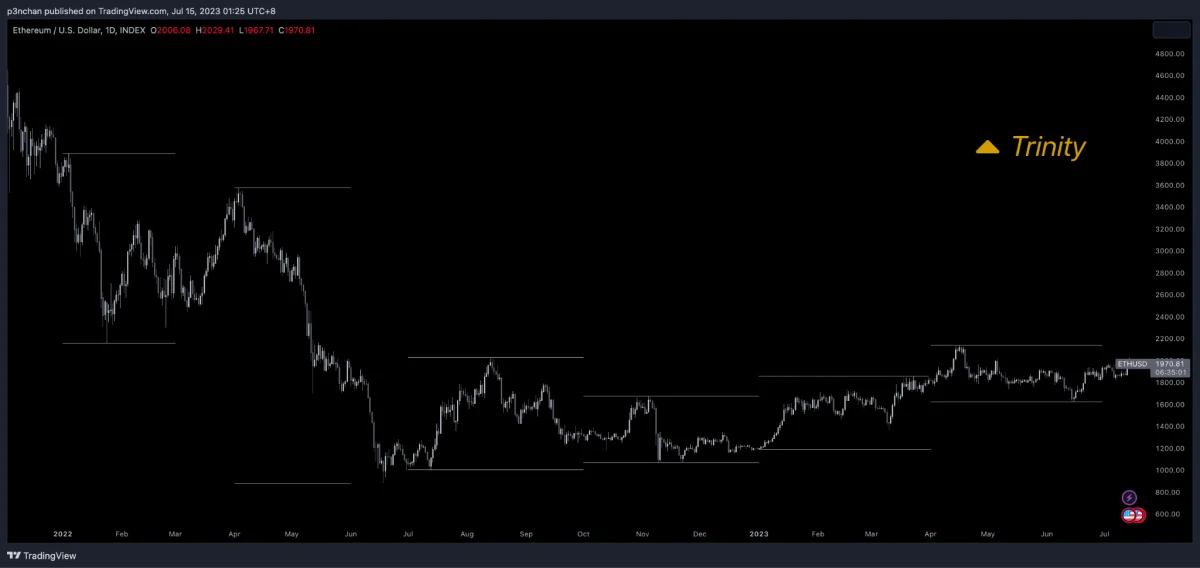
Figure 1. Trinity in practice.
When trading, we try to find the previous three timeframes to help read key swing points. This standard of looking for three timeframes is called Trinity. For example, we may find the highs and lows of the past three months, three weeks, and three days, then mark them on the chart.
This cycle-search method based on “three” has one feature: it gives us a defined price range. Because the market is ranging most of the time, ICT summarizes a system and reaches this conclusion: most of the time, price operates inside Trinity.
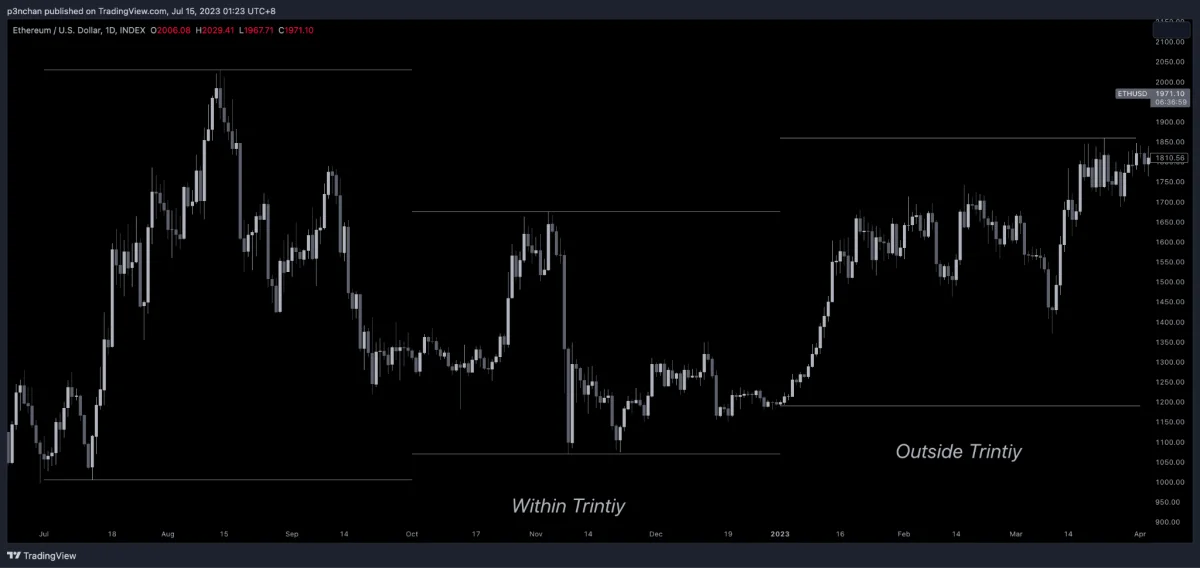
Figure 2. Trading within Trinity and trading outside Trinity.
Using Figure 2 as an example, when price has operated between the Trinity high and low over the past three months, we call it trading within Trinity. Conversely, if price breaks above the past three-month high or below the past three-month low, it is trading outside Trinity.
Breaking Trinity: When Trend Behavior Appears
When a cycle breaks above the Trinity high or below the Trinity low, price may continue and break the previous Trinity in the same direction. At that point, we focus on the behavior around those highs and lows. See Figures 3 to 5 for the detailed examples.
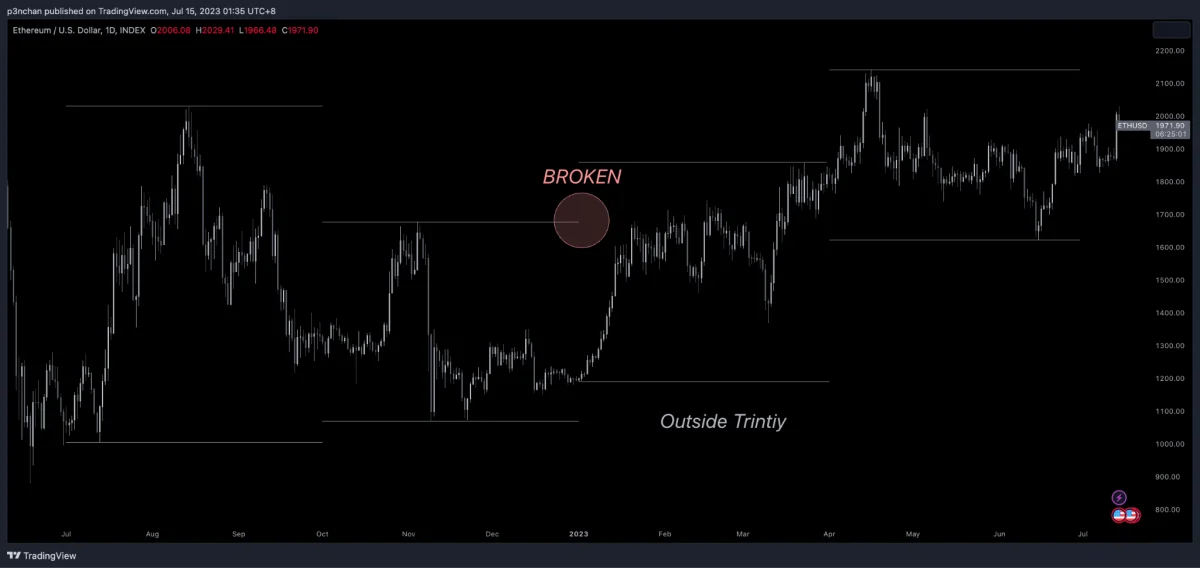
Figure 3. Here we focus on the Trinity of the second cycle. In the third cycle, price breaks it, which is the BROKEN area in the chart.
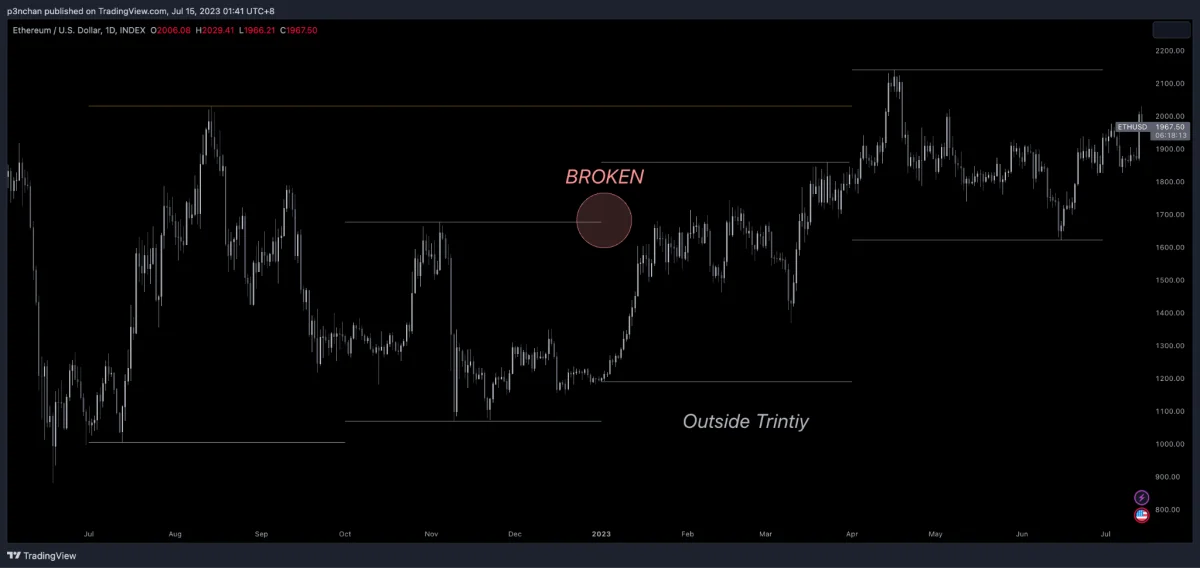
Figure 4. We begin watching the previous same-direction Trinity high, shown by the gold line and belonging to the first cycle. A breakout may happen here.
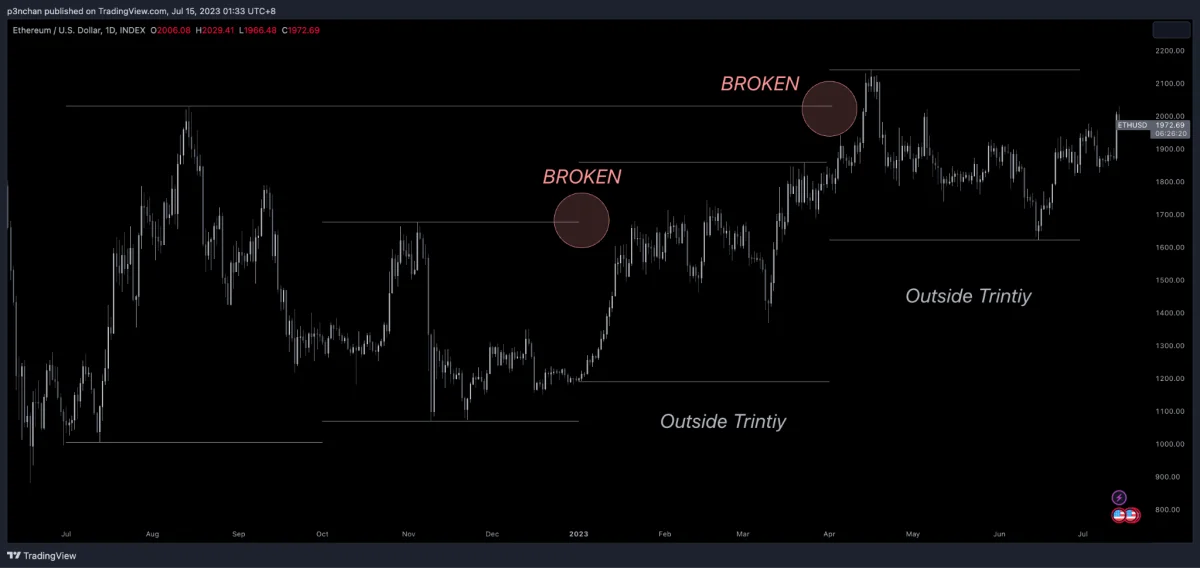
Figure 5. Price breaks the earlier Trinity again, at the BROKEN area on the right side of the chart. Even though it happens later, it still shows trend behavior.
By the way, when price breaks Trinity, you can use the Fibonacci tool from the previous article, combining OTE with 1.618 and 2 labels to mark entries and targets.
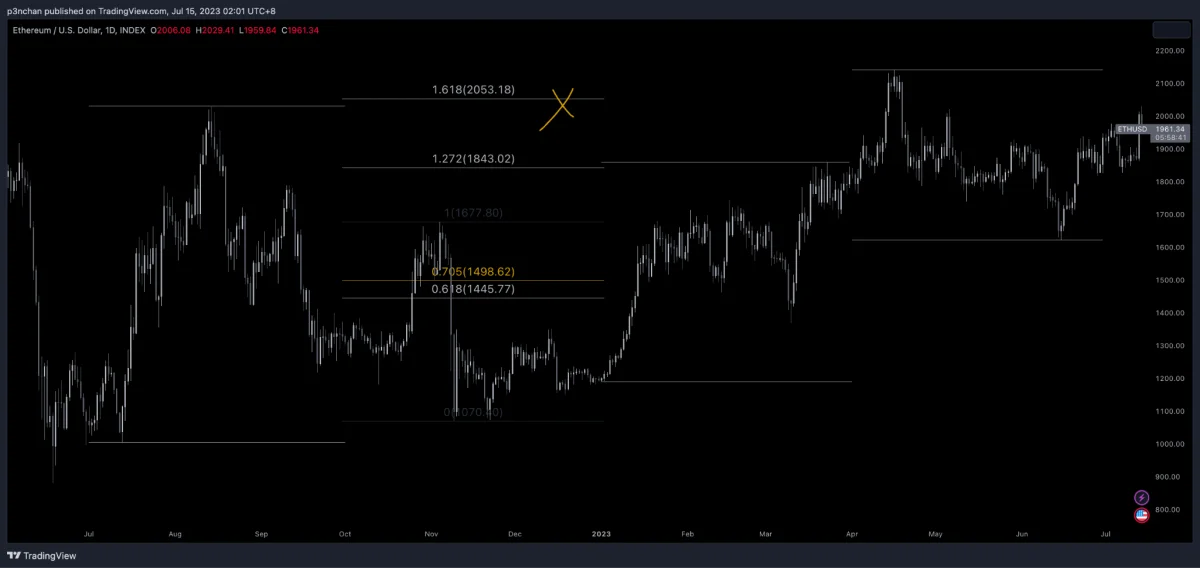
Figure 6. Using Fibonacci extension to draw entry and exit points.
Afterword
When using Trinity analysis, we still need to compare it with the higher timeframe and check whether the direction is aligned or opposite. The Bias created by that trend still dominates our trading behavior.
Beyond using monthly Trinity for the daily cycle, as mentioned above, H4 can use weekly Trinity, and H1 or M15 can use daily Trinity for reading the market.