
This article is only a personal trading study note and does not constitute investment advice. Trading involves risk. Make independent judgments and take responsibility for your own decisions.
Market Profile and Time Price Opportunity, part 2, discusses the application of POC and IB.
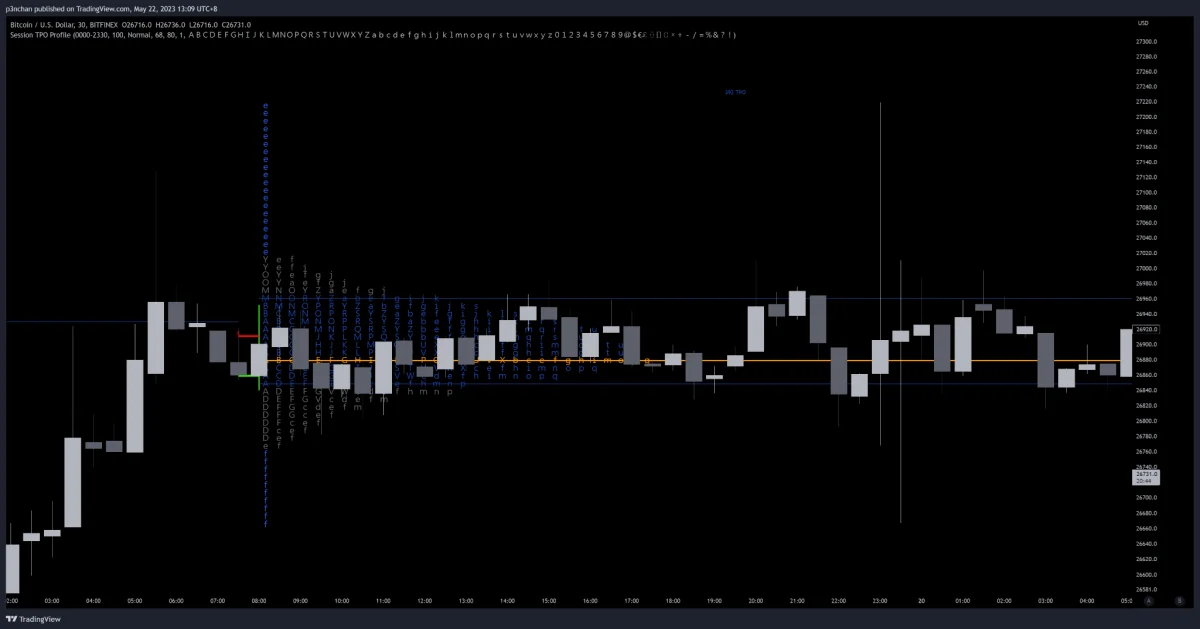
Point of Control, or POC, refers to the price area with the largest accumulated distribution inside a range. In the chart above, the orange letters stack into the tallest price band, which is the POC. In general, POC represents a reasonable-value price. You can think of it as a magnet: when price moves away from POC, there is a pull that draws price back.
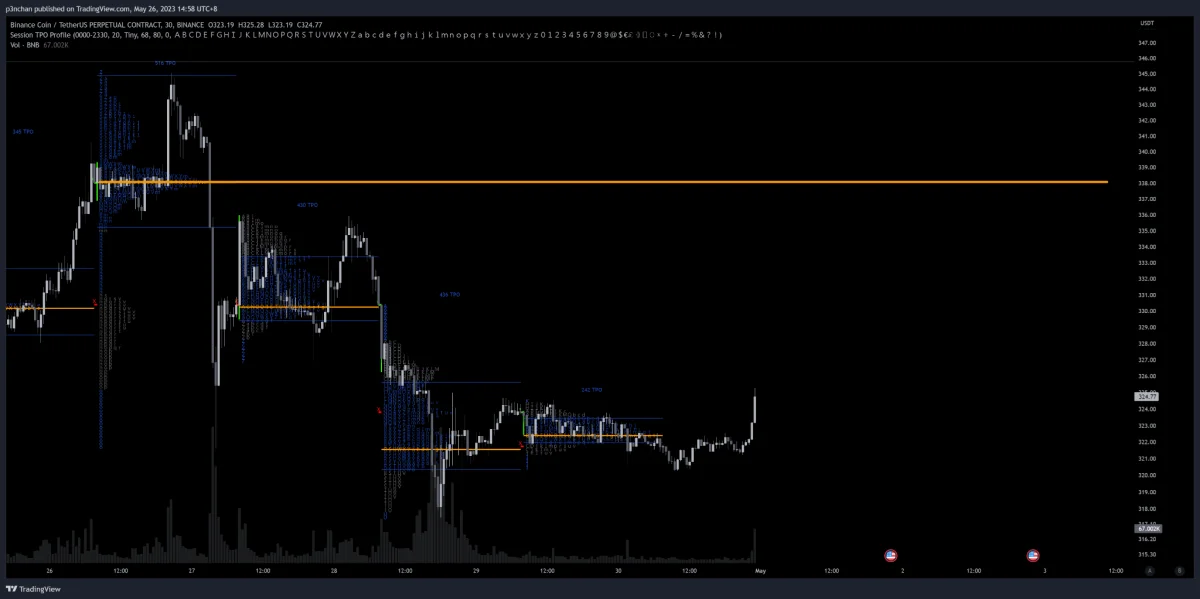
Like many other trading concepts, POC works best when it remains fresh and untested. At that point, we call it a naked POC, or nPOC.
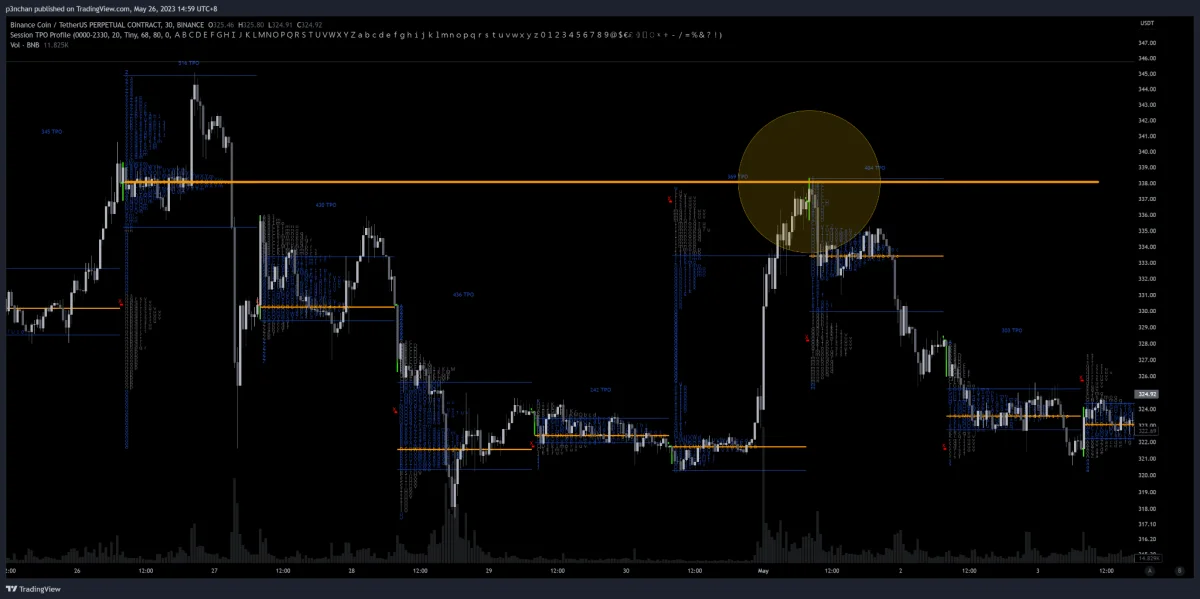
nPOC can be used as an exit point, but usually not as an entry point because behavior after entry is not easy to predict. Similar to the price action discussed in Auction Market Theory, part 3, if price touches nPOC with strong momentum, it is very likely to later move away from that price area.
Initial Balance
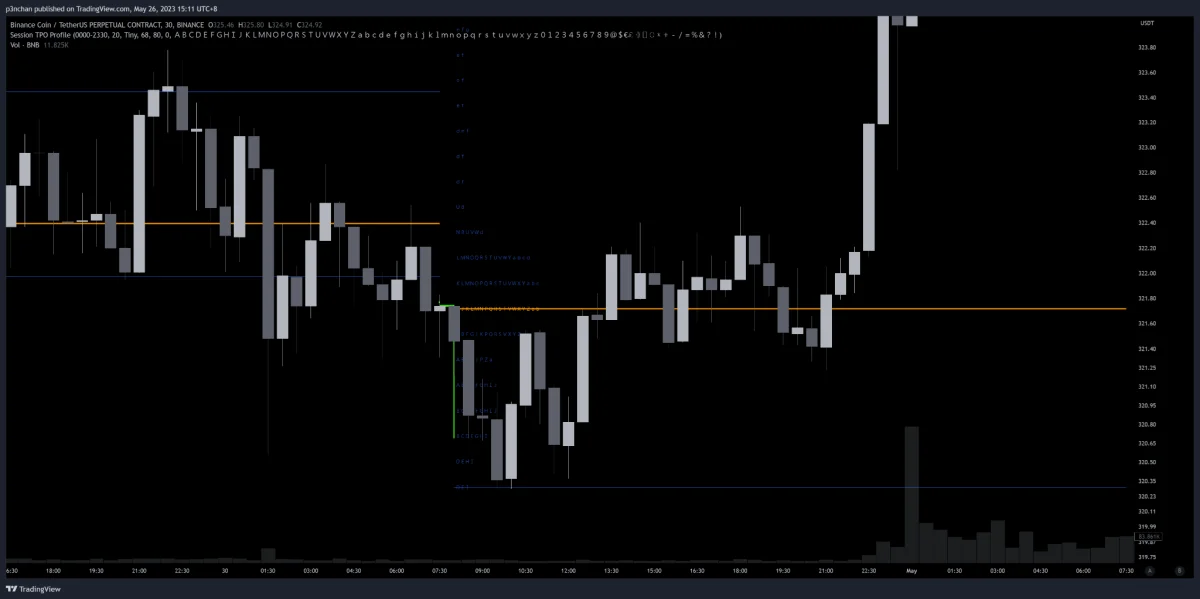
Initial Balance, or IB, is the price range of the first hour after the open. In the 30-minute chart above, the two candles after the open define that day’s IB.
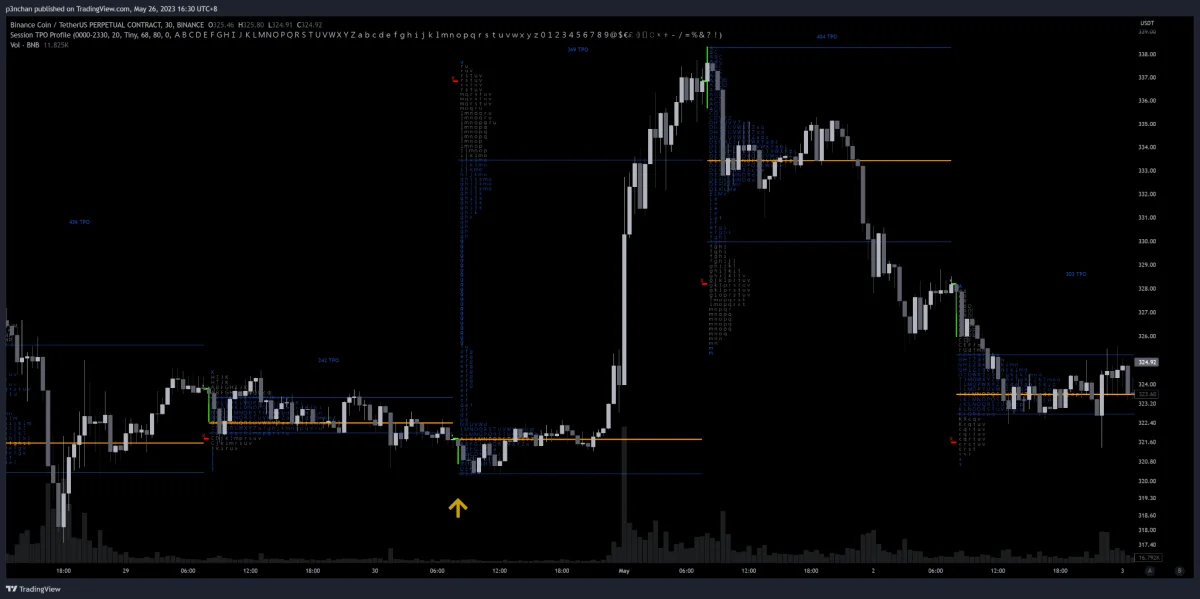
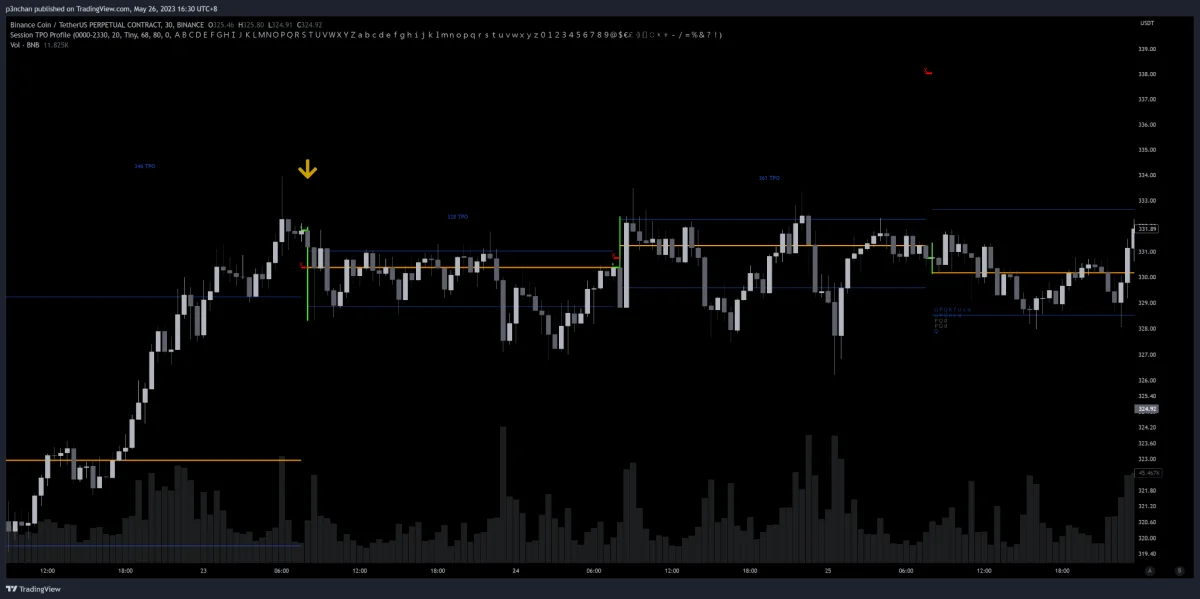
IB is the baseline range for TPO. When IB is small, the day may develop into a trend day. When IB is large, the day is more likely to become a ranging day.
From the perspective of bull and bear strength, when price falls below IB, bears have control of the market. Conversely, when price rises above IB, bulls have control.
How to Define Initial Balance
Because IB is defined using the first hour after the open, the time used for IB changes across markets with different opens. For cryptocurrency, the session opens at midnight London time, which is 8:00 a.m. UTC+8, so IB is counted from that hour. Foreign exchange is different. Although FX, like crypto, trades 24 hours a day, it is mainly split into three trading sessions and does not have one fixed opening time. Penchan thinks liquidity is better during the European and U.S. sessions, so using those opens as IB is more reasonable. The European, London, session opens at 7:00 a.m. London time, or 3:00 p.m. UTC+8. The U.S. session opens at 9:30 a.m. New York time, which is 9:30 p.m. UTC+8 during daylight saving time and 10:30 p.m. during standard time.
Next time, we will continue discussing TPO details and introduce them more carefully. For TPO indicators, Penchan mentioned some options that can be used on TradingView in a past post, for reference: https://www.instagram.com/p/ClBAQBqpElT/ .