
This article is only a personal trading study note and does not constitute investment advice. Trading involves risk. Make independent judgments and take responsibility for your own decisions.
Auction Market Theory, AMT, part 3: exploring price action around fair value ranges and related examples.
In the previous two articles, we studied the basic concepts of Auction Market Theory, or AMT. This article applies those concepts to real markets, analyzes five common price action patterns, and provides a cheat sheet at the end for easier saving and review.
When price is in a sideways ranging period, we can observe price movement within a fixed range. Usually, it does not move far away from the fair value range. This kind of price action can be seen as the accumulation of responsive behavior from each lower timeframe inside a higher timeframe. From another angle, when price is in Balance, we can expect it to range between the high and low of the fair value range, meaning value area high and value area low.

Figure 1. Ranging model inside a fair value range
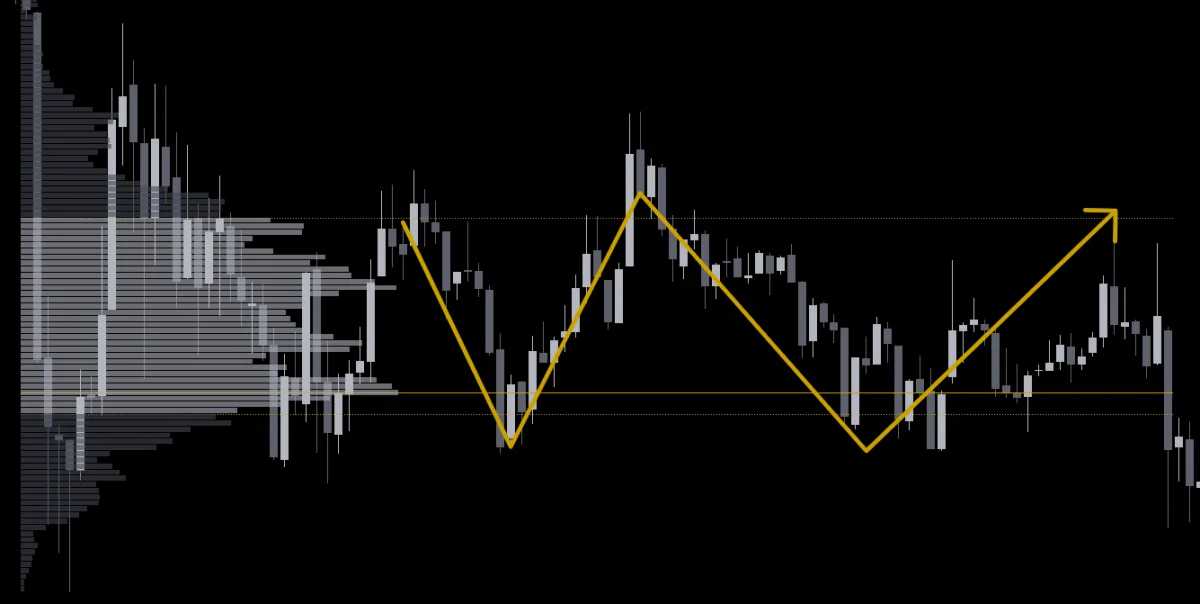
Figure 2. Range movement inside the fair value range https://www.tradingview.com/x/zis6dd6Q/
2. Response: Entering the Fair Value Range
When price enters a prior fair value range, it may touch the other side. During this process, price may first test the edge of the range before continuing toward the other side.

Figure 3. Model of entering a fair value range
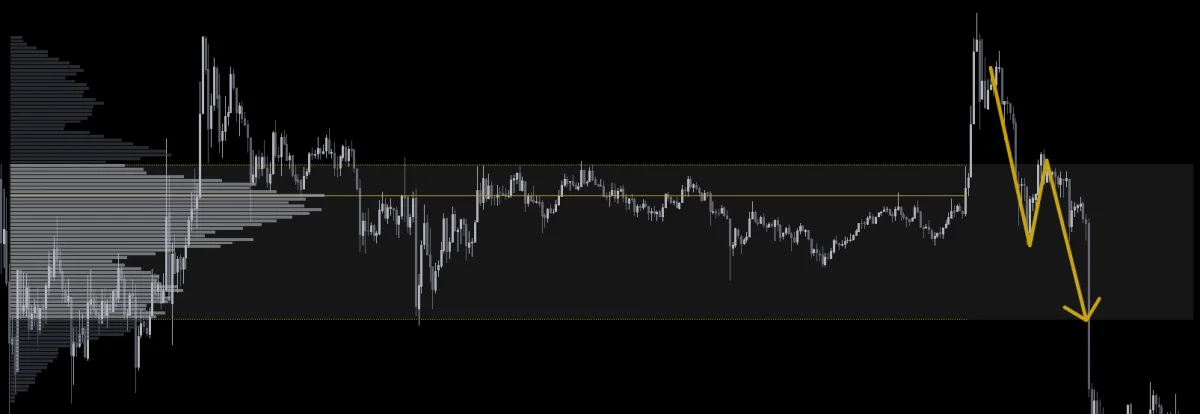
Figure 4. After entering the fair value range, price retests the edge and then moves toward the other side https://www.tradingview.com/x/glMQ930Z/
3. Strong Momentum: Strong-Momentum Price Action Toward POC
If price enters the fair value range with strong momentum behavior, it is very likely to touch POC, point of control, meaning the dense area, and then produce a strong reaction before leaving the fair value range. In other words, this kind of behavior is less likely to create a simple edge retest followed by movement to the other side.
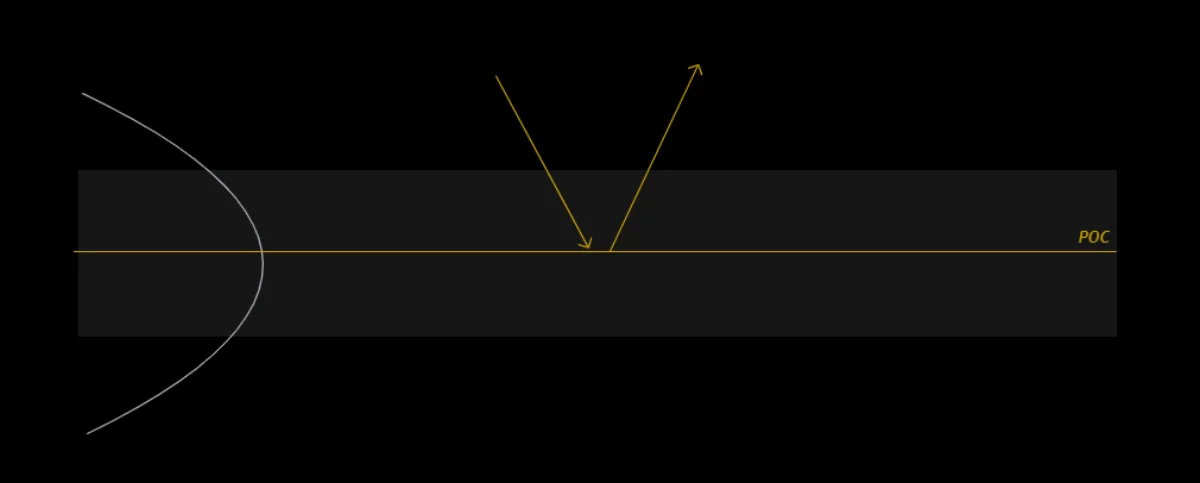
Figure 5. Strong-momentum behavior model toward POC
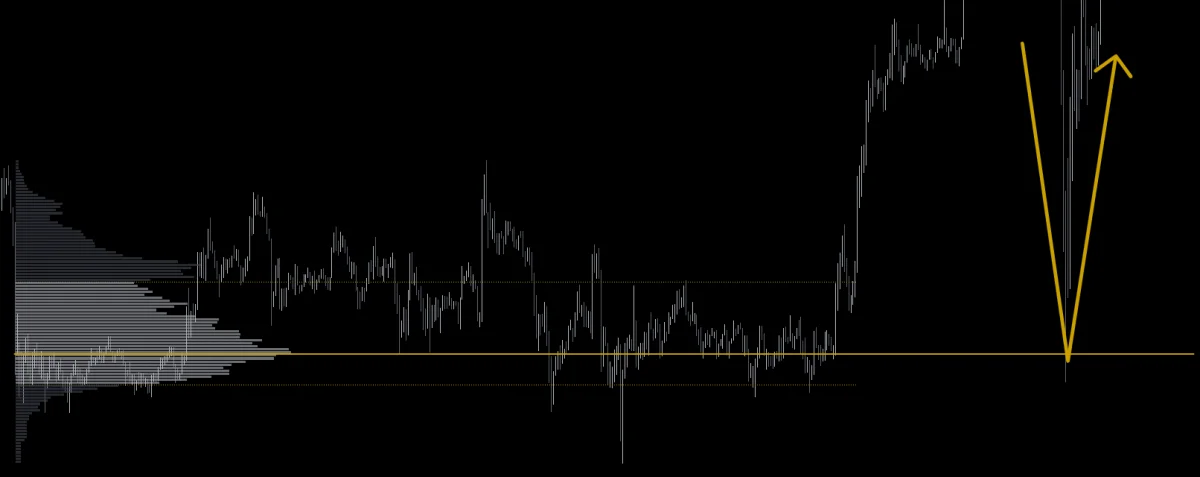
Figure 6. After price creates strong-momentum behavior, it touches POC and leaves the price range with strong momentum https://www.tradingview.com/x/lSNKGWSI/
4. Initiative: Price Action Leaving the Fair Value Range
After price goes through Accepted Auction behavior, as discussed in the middle article of Auction Market Theory, it leaves the fair value range. This usually comes with meaningful volume and may retest the original fair value range, creating a support/resistance flip.
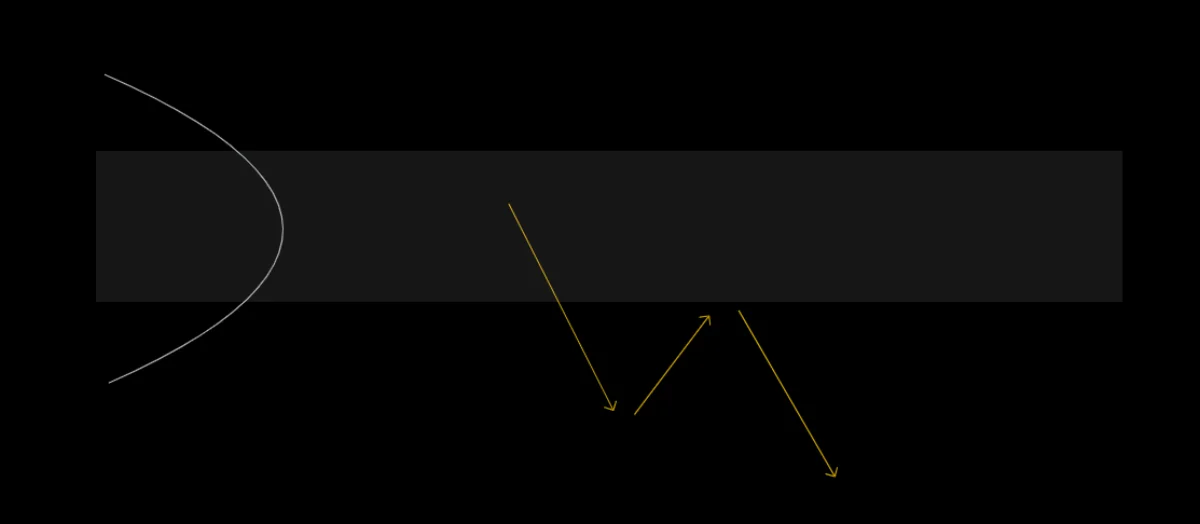
Figure 7. Model of leaving the fair value range
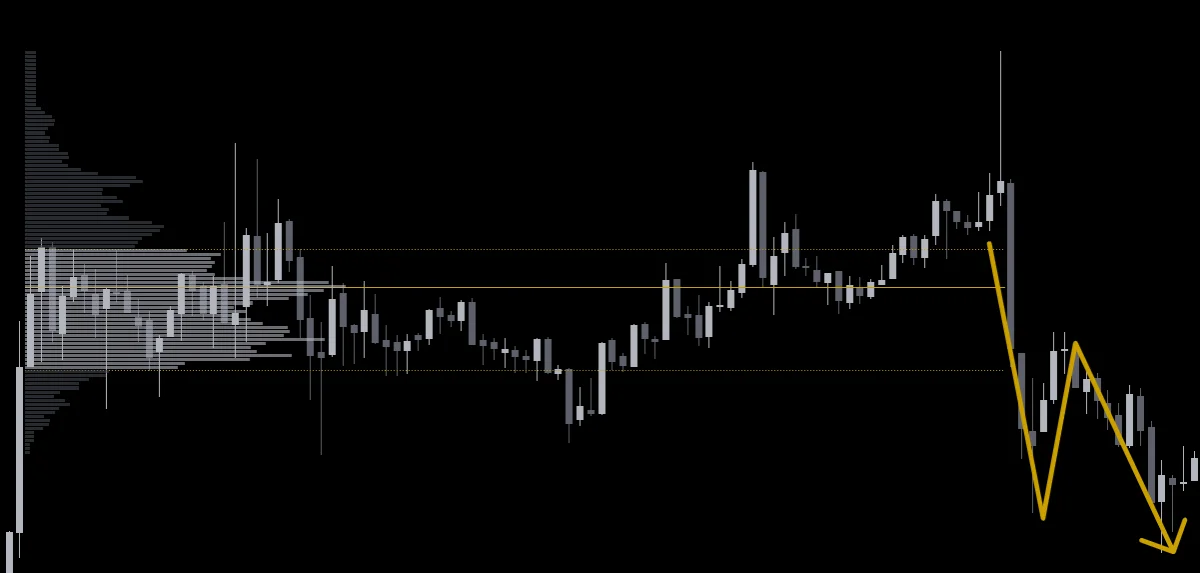
Figure 8. After price leaves the fair value range, it retests https://www.tradingview.com/x/pfxdp4cl/
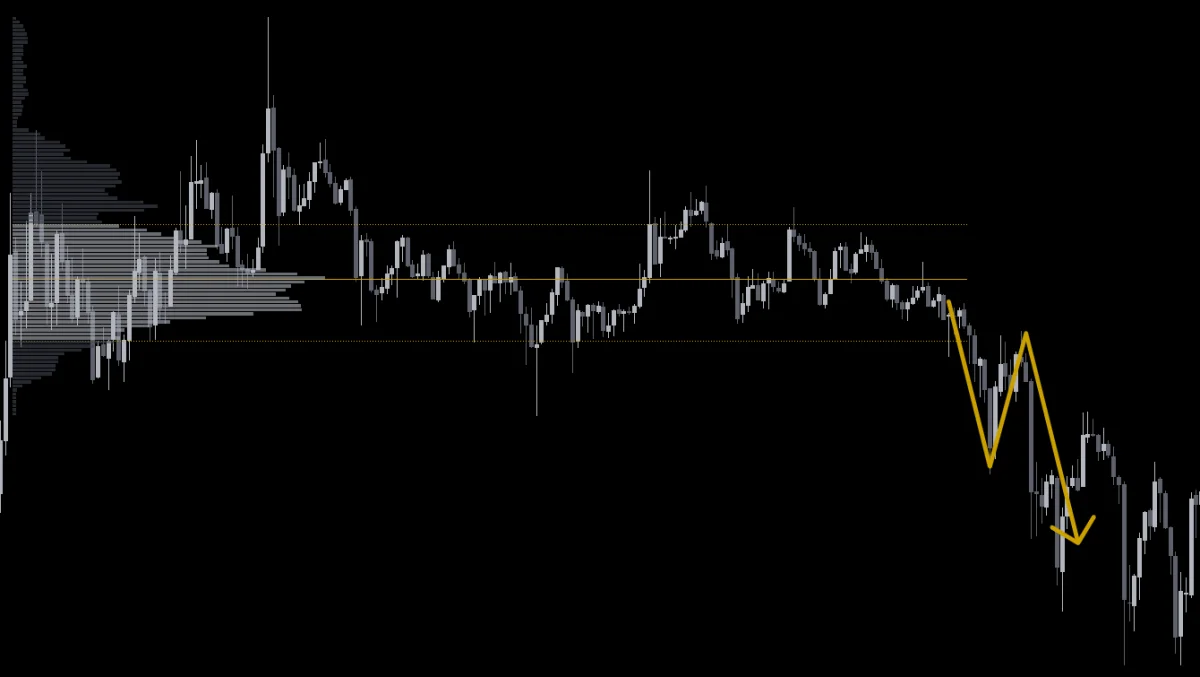
Figure 9. Price left the fair value range and retested https://www.tradingview.com/x/zeJLBc7M/
5. Accumulation: Price Action Accumulating at the Edge
When price accumulates at the edge of the fair value range, whether through time or volume, after enough time it may break through that edge.
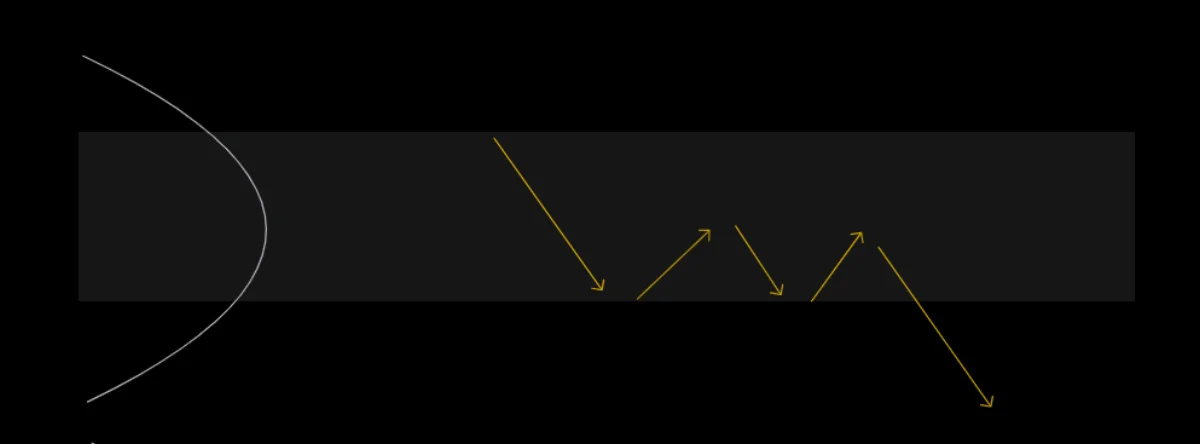
Figure 10. Model of accumulation at the edge of a fair value range
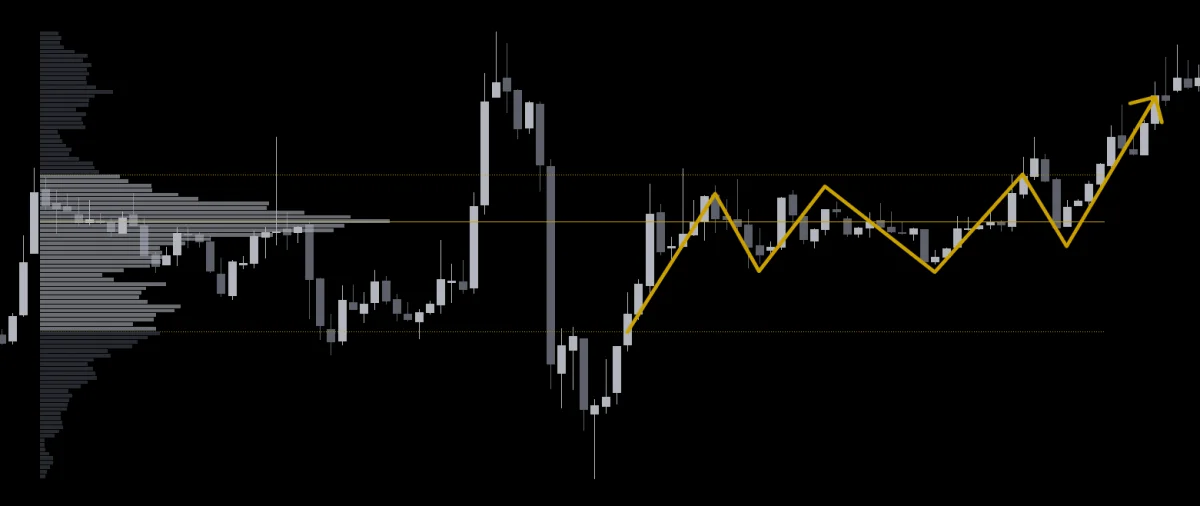
Figure 11. When price accumulates at the edge of a fair value range, it has a chance to break through https://www.tradingview.com/x/nnflixOI/
6. Summary
This article used Auction Market Theory, AMT, to analyze five price action patterns in real markets: range movement, response, strong momentum, initiative, and accumulation. By studying these patterns in more detail, traders can better understand market price action and build corresponding trading strategies that support daily trading plans.
To avoid taking up too much space with a long cheat sheet, a link is provided below for download and future use in live trading.
Example cheat sheet https://blog.p3nchan.com/auction-market-theory-price-action/
Auction Market Theory, Part 1: Exploring Order Liquidity and Fair Value Range Mechanics in Financial Markets https://da.studio/archives/12423
Auction Market Theory, Part 2: Exploring Order Flow Movement Patterns and Market Behavior https://da.studio/archives/12456
Note: This article is mainly based on TradingRiot. Search online if you want to read the original.