
This article is only a personal trading study note and does not constitute investment advice. Trading involves risk. Make independent judgments and take responsibility for your own decisions.
Auction Market Theory, AMT, part 2: exploring order flow movement patterns and market behavior.
In the previous article, we introduced the basic ideas of Auction Market Theory, or AMT, including buying, selling, and Balance. This article goes deeper into the movement patterns built on top of those concepts.
According to Auction Market Theory, the market spends about 80% of its time inside a fair value range. Sometimes, however, the market leaves that area. When that happens, two types of behavior may appear: Responsive Activity and Initiative Activity.
Responsive Activity
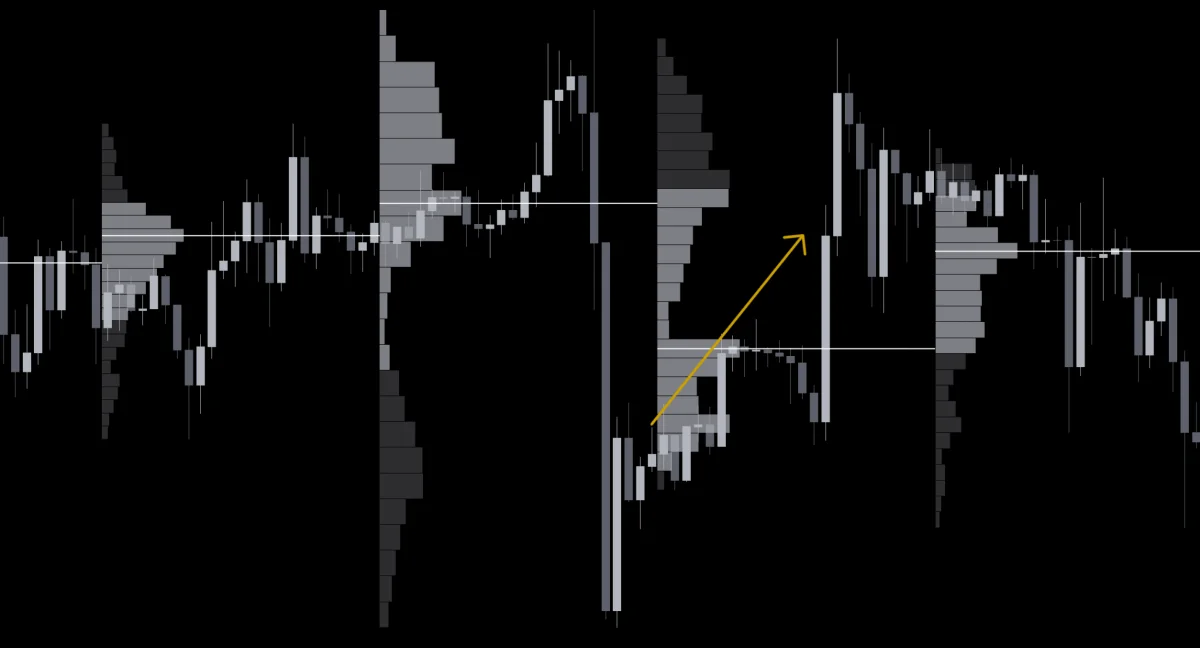
Figure 1. Responsive Activity: market price returns to the prior fair value range
Under normal conditions, when the market breaks below a fair value range, we expect buying to appear because price is cheaper. Conversely, when the market breaks above a fair value range, we expect selling to appear because price has become higher. Responsive Activity works like a magnet, pulling the market price that has moved away back into the original fair value range.
For example, if one day’s open is above the previous day’s fair value, Responsive Activity leads us to expect price to fall back into the previous day’s fair value range. Conversely, if one day’s open is below the previous day’s fair value, we expect price to return to that prior fair value range, as shown in Figure 1.
Responsive Activity often appears during sudden price rises or drops, and also in Stop Hunt / Stop Run / Sweeping behavior. After the market obtains Liquidity, it returns to the original fair value range.
Initiative Activity
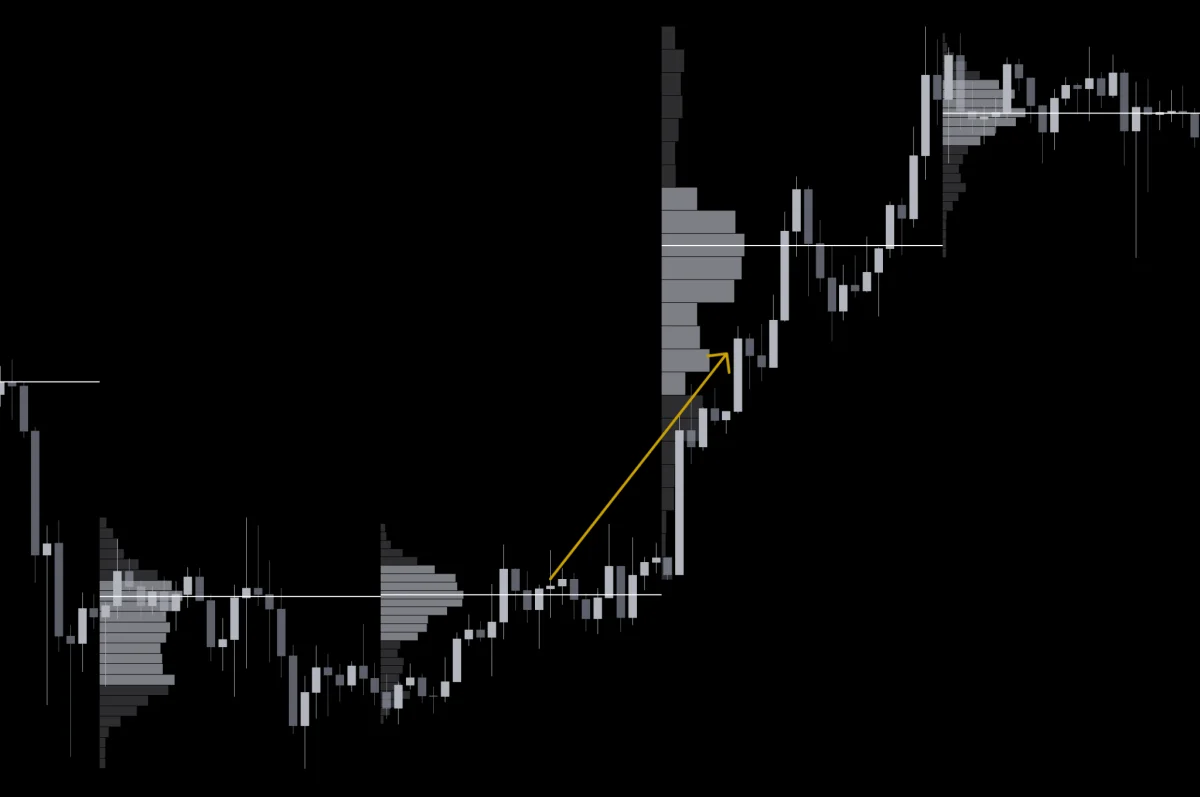
Figure 2. Initiative Activity: the market accepts the move away from old fair value and accepts a new fair value
Initiative Activity is different from Responsive Activity. We cannot judge in advance that Initiative Activity will happen. Under Auction Market Theory, when the market breaks below fair value, selling pressure cannot be predicted from the start; when the market breaks above fair value, buying pressure also cannot be predicted in advance, as shown in Figure 2.
This behavior only appears when the market environment changes and fair value changes with it. At that point, the market accepts the breakout and forms a new fair value.
2. The Relationship Between Price Action and Volume in Auction Markets
Next, let’s look at how to find clues on the chart and discover possible price movement:
Failed Auction
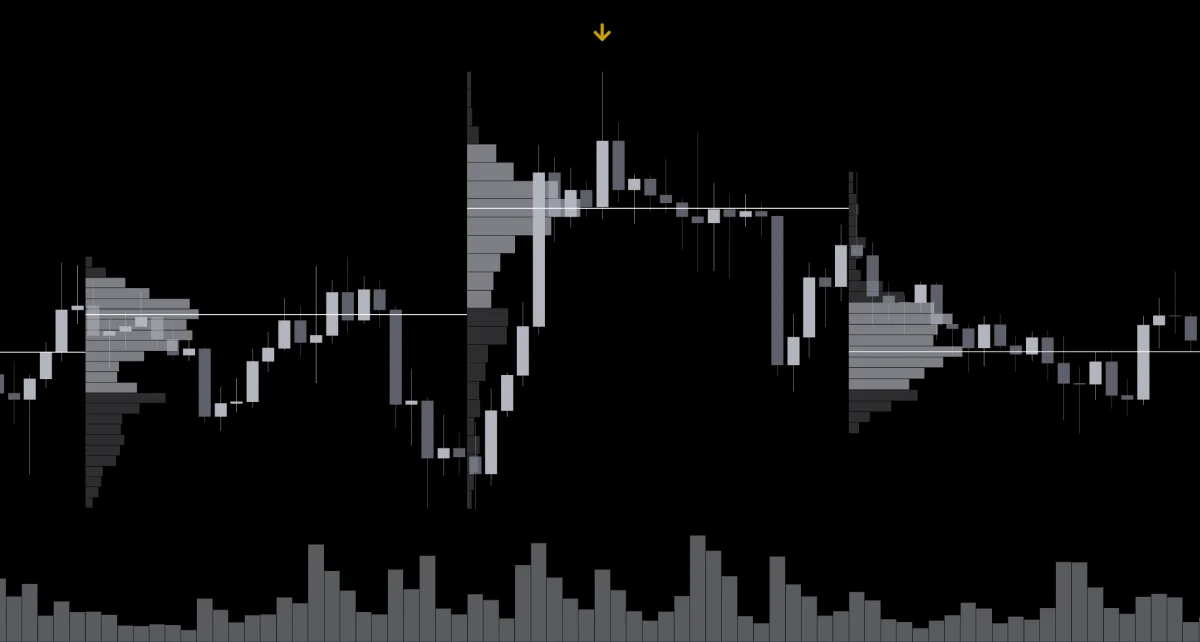
Figure 3. Failed Auction: price breaks out without meaningful volume
When price breaks through a fair value range but is not accepted by the market, it forms a Failed Auction. On the chart, this often appears as a breakout without volume, or as a long wick. A V-shaped reversal usually also represents a type of Failed Auction.
Accepted Auction
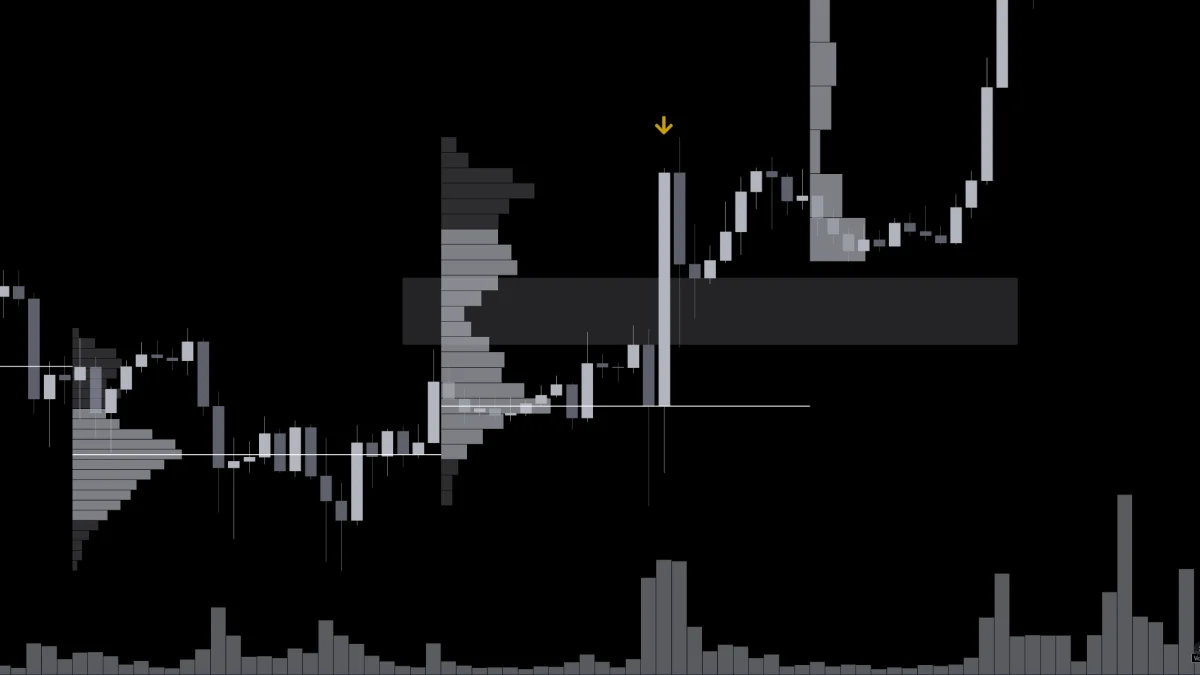
Figure 4. Accepted Auction: price breaks out with meaningful volume and creates a support/resistance flip
When the chart breaks through a fair value range, if it comes with significant volume or clear price action, such as a close outside the range, it can be considered an Accepted Auction. A new fair value may appear because of it. At this point, a support/resistance flip may appear on the chart, and traders can use these signals for trading.
After the new price is accepted by the market, there is a chance it will test the old fair value range and then continue the new trend.
3. Summary
In this article, we discussed market price movement behavior, including Responsive Activity and Initiative Activity, as well as Failed Auction and Accepted Auction in real chart conditions. In the next article, we will introduce common patterns that appear on actual charts and show how to use Auction Market Theory in operation.
Note: This article is mainly based on TradingRiot. Search online if you want to read the original.