
This article is only a personal trading study note and does not constitute investment advice. Trading involves risk. Make independent judgments and take responsibility for your own decisions.
Market Profile and Time Price Opportunity, part 3, look at how TPO price action can help judge trends.
Following the POC and IB concepts discussed in the middle article of the Market Profile and Time Price Opportunity series, we can extend those ideas and combine them with real cases to understand how they are applied.
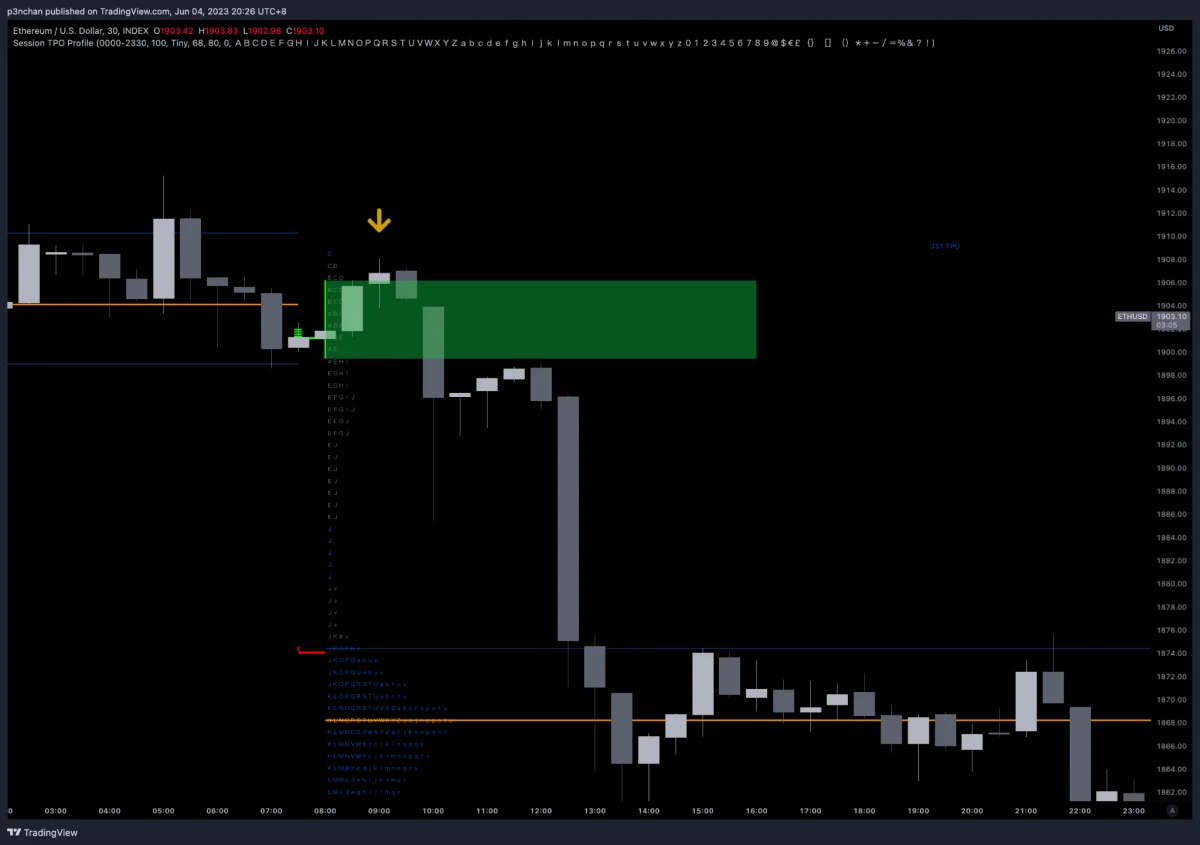
As mentioned in the middle article of the Auction Market Theory series, a Failed Auction forms when price breaks out of the fair-value range but is not accepted by the market. Combining that with the IB concept, when price tries to break out of IB but does not stay outside IB for more than 30 minutes, a return into IB may lead to a test of the other side.
At the yellow arrow in the chart above, price tried to leave the original IB range but did not remain outside it long enough. That suggested the market might struggle to keep rising. Price then returned to the IB range and tested the IB low.
Poor High and Poor Low: Trend Weakening
Poor High and Poor Low refer to a Market Profile condition where lower-timeframe traders lack confidence in market direction, and some traders begin to push the market in the opposite direction. This usually appears near the end of a trend, where overall momentum starts to weaken.
Poor High and Poor Low represent market inefficiency. From a market maker’s perspective, that kind of inefficiency is usually retested. Inefficiency means the market price is not accepted by most participants. Market makers will often try to return to that area, create Liquidity, and improve trading efficiency there. From the Auction Market Theory perspective, the retest completes the auction in that area.
Poor High and Poor Low usually appear in several forms:
- Two or more TPOs
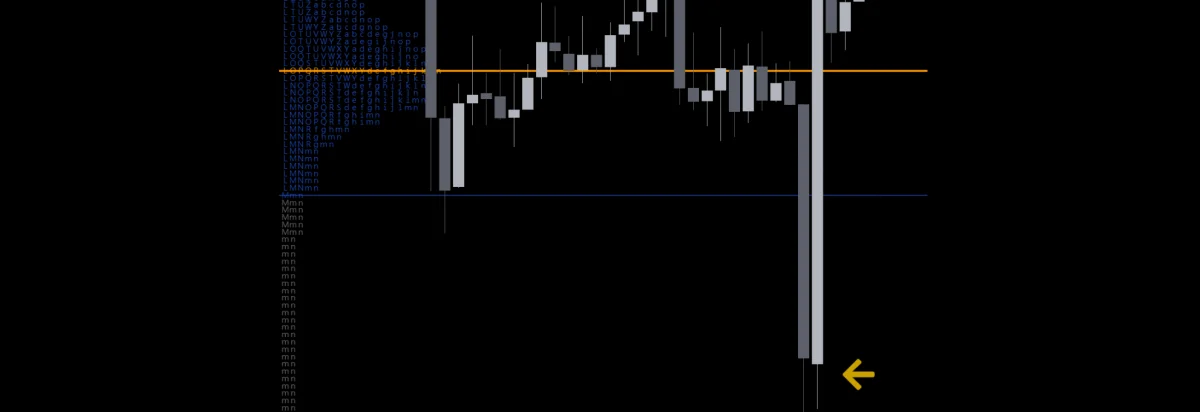
- Two consecutive days with the same high or low
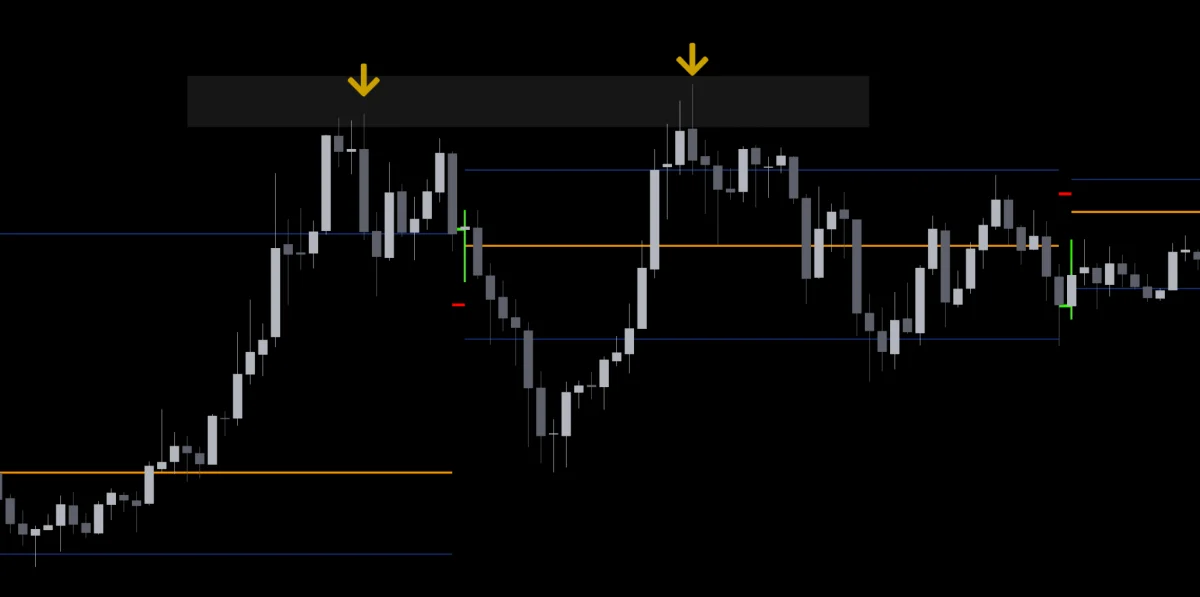
How should you trade Poor Highs and Poor Lows? In practice, as mentioned above, when we see Poor Highs or Poor Lows inside the current trend, we can make an early judgment that the trend may be weakening. If they appear during a ranging or choppy period, those areas are very likely to be repaired soon to restore efficiency.
Excess: The End of a Trend
Excess usually appears at the top or bottom of a Market Profile and shows up as a chart pattern with a long wick.
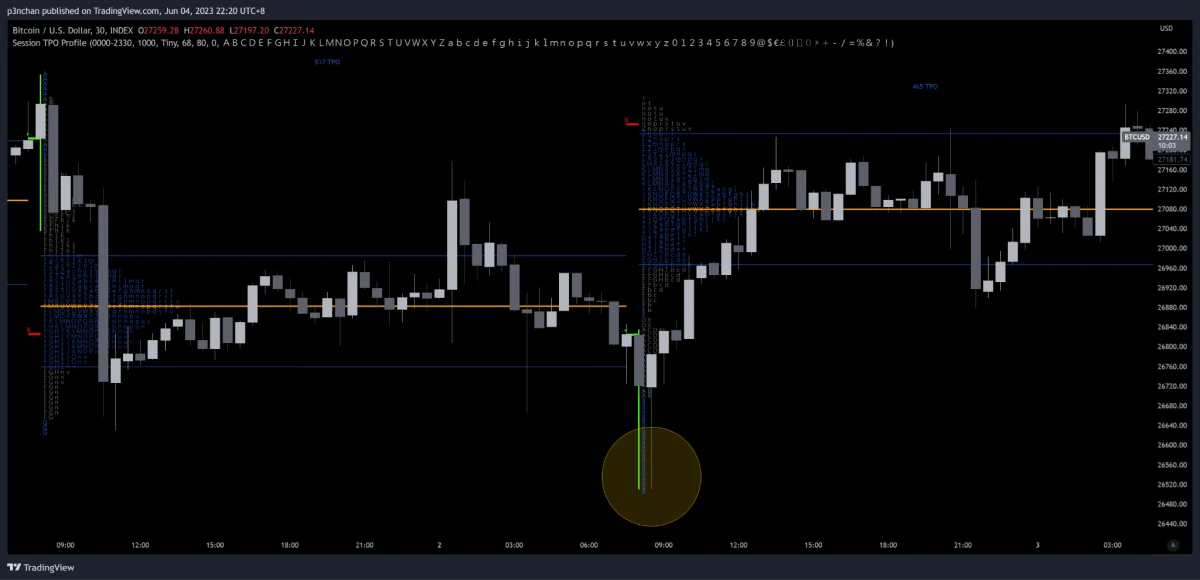
This long-wick “Excess” means that buyers entered the market when price fell to a certain level. Conversely, when price rises to a certain level and Excess appears, it means sellers entered the market.
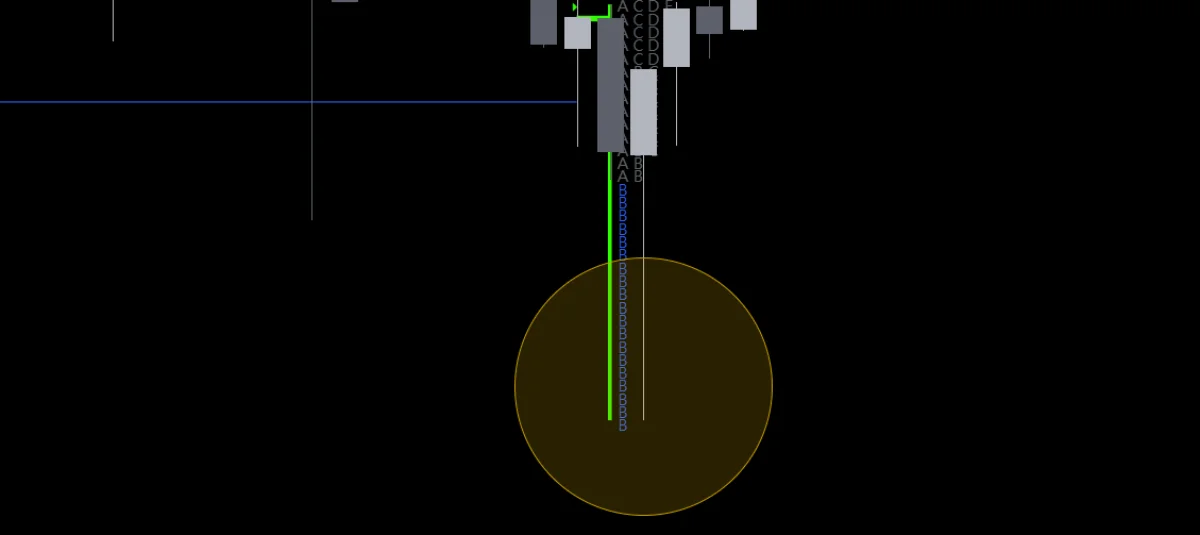
In the chart above, period B sold off, then buyers entered the market and bought price back up.
Generally, Excess also represents the end of one auction and the start of another. It often appears at the tail end of a trend. From a buying-and-selling perspective, aggressive buyer or seller entry marks the end of that trend.
Summary
Here we used price action derived from TPO concepts to explain practical applications behind the structure. Learning these patterns and behaviors can help make reasonable judgments about market direction. When using this type of technique, I recommend treating it as a supporting tool that fits your own trading style.