
This article is only a personal trading study note and does not constitute investment advice. Trading involves risk. Make independent judgments and take responsibility for your own decisions.
Market Profile and Time Price Opportunity, part 1: time, price, and value moving together.
A market is a place made of buyers and sellers. A thriving market is built by active buying and selling, while a shrinking market is often caused by weak trading activity. We can observe this in any goods market. For example, when holidays arrive, foot traffic surges, causing sales volume and price fluctuation to increase. During seasonal changes, out-of-season goods are often sold at discounts, attracting sharp consumers to buy. Although merchants sell at lower prices, they generate cash flow and help capital rotate, pushing a new cycle forward. This is one of the economic patterns of markets.
When price differs from people’s psychological expectation of value, disagreement appears, forming the basis for market change. Peter Steidlmayer summarized 30 years of futures-market experience and turned price and market change into a theory: Market Profile, also called four-dimensional market theory. Below, we call it MP.
The core idea of this theory is that price and value will always diverge. Only when divergence appears can investors capture moments when price is below value and buy those goods.
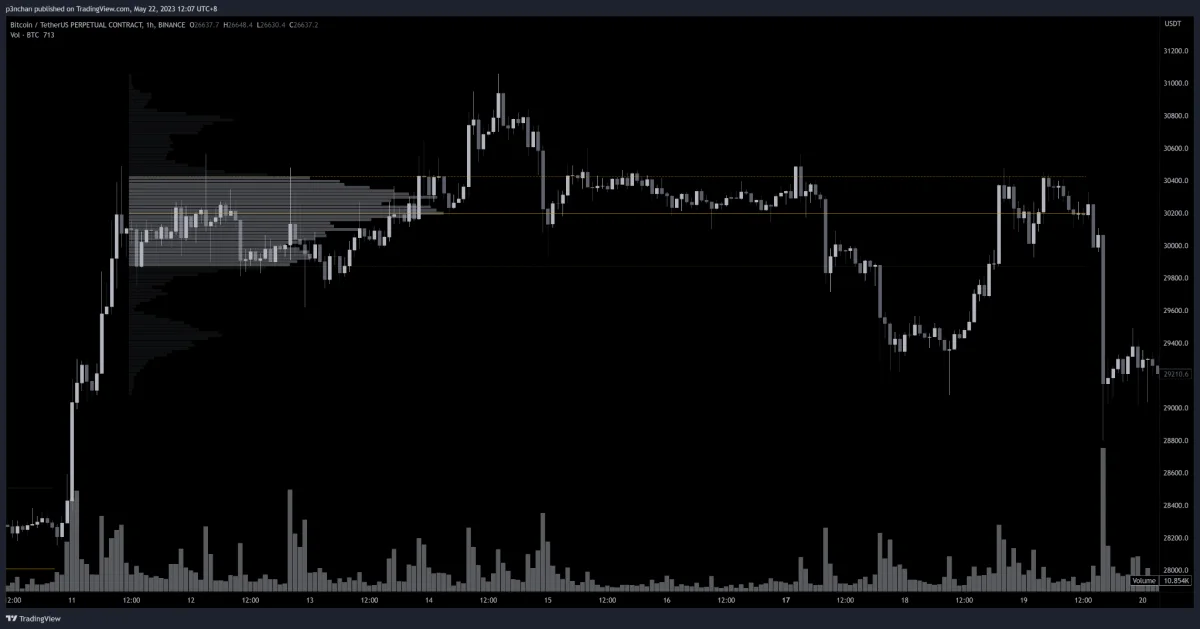
MP is a way to organize market information. It can include price and fair value, undervalued and overvalued areas, time, and other information. Compared with the four order-flow tools and their strategies, MP is a method for integrating market data. It is not a trading system or trading strategy, but a more integrated analytical tool.
Time Price Opportunity: Reading the Combination of Price and Time
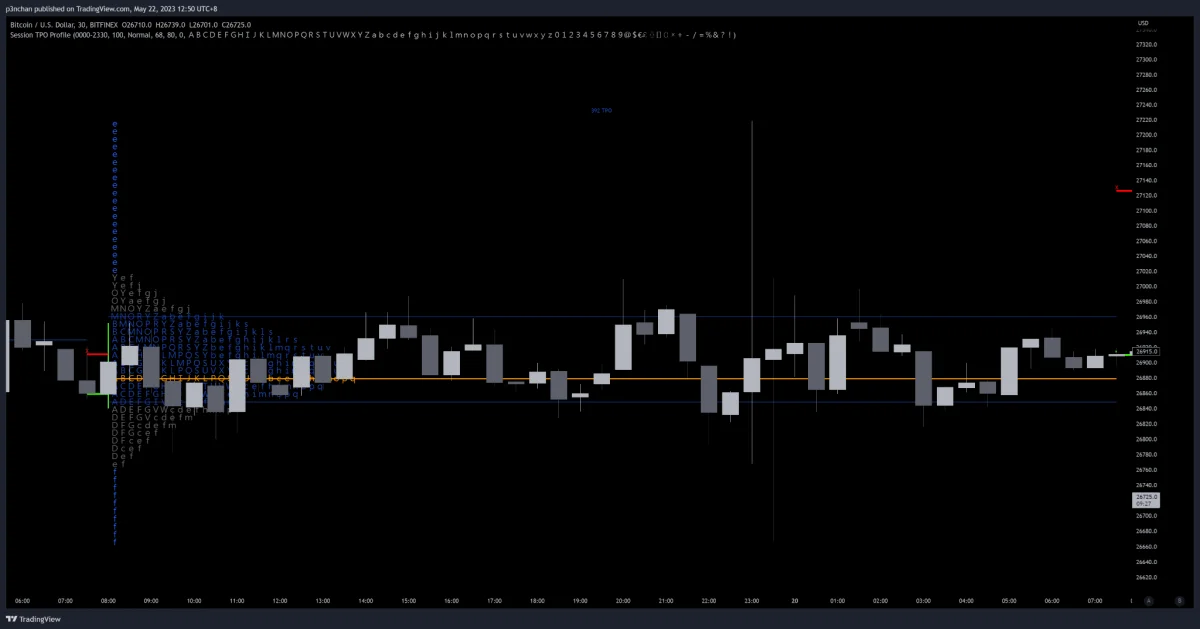
Time Price Opportunity, or TPO, is a statistical method for tracking price changes at each point in time. The chart above shows a TPO chart compressed to the left side.
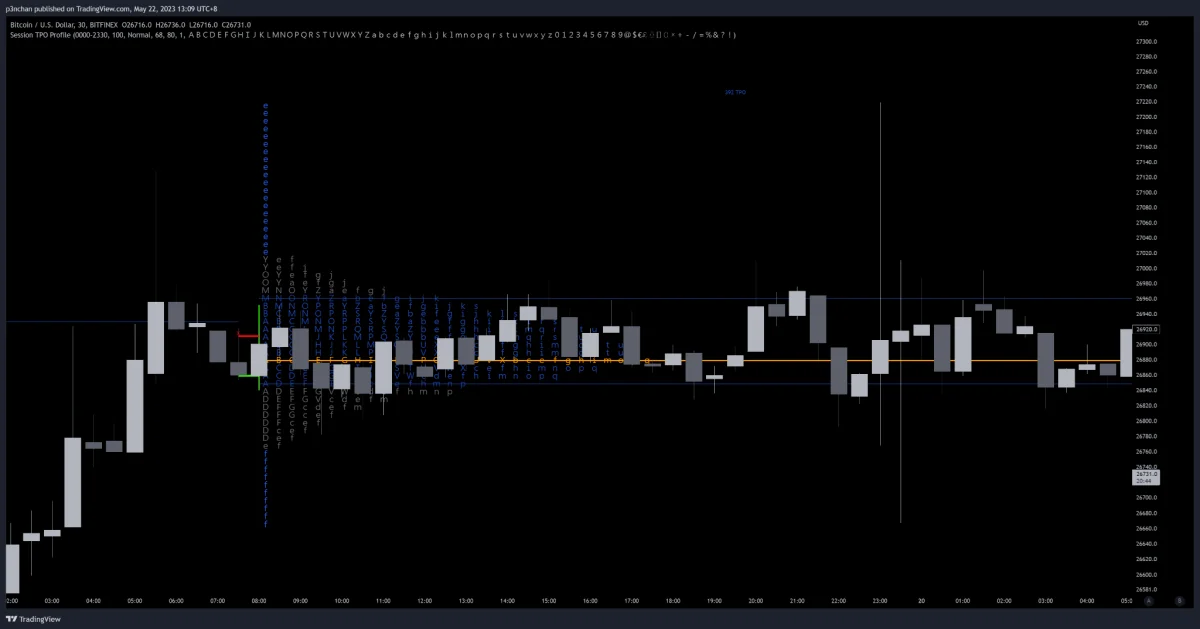
When using TPO, we read it with intraday time periods. The most common timeframe is the 30-minute timeframe. Each 30-minute candle’s traded area is represented by one symbol. Here, Penchan uses A to Z, then a to v, for a total of 48 letters, representing 48 thirty-minute periods in one day. The reason for using 48 is that cryptocurrency trades 24 hours a day, giving us 48 time periods for counting price locations. U.S. stocks or other markets have different numbers of observed time periods because their trading hours differ.
When marking TPO, we can treat each candle as a full strip of symbols distributed on the chart according to time. Then we compress it to the left side, which forms the common TPO chart shown above.
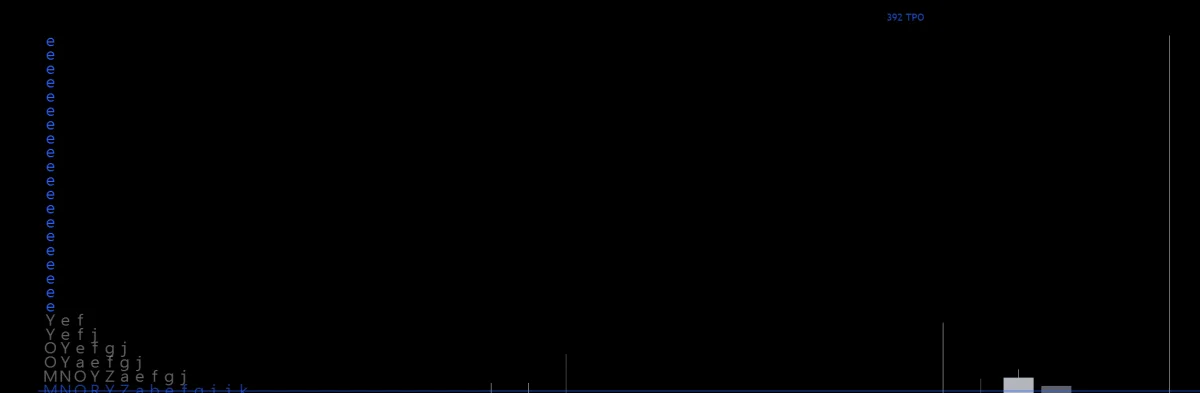
On the right side of the chart above, we can see price reaching a high level and pulling back. Based on the time calculation, this happened during the e time period, so that e time period is recorded. After compression, it appears on the left side.
Here is another reminder: each e-to-e interval represents a difference of 100 points, such as 100 USDT. This part can be set according to preference. The difference is the density. Sometimes the software does not support denser settings, so this part requires your own testing.
TPO Value Area
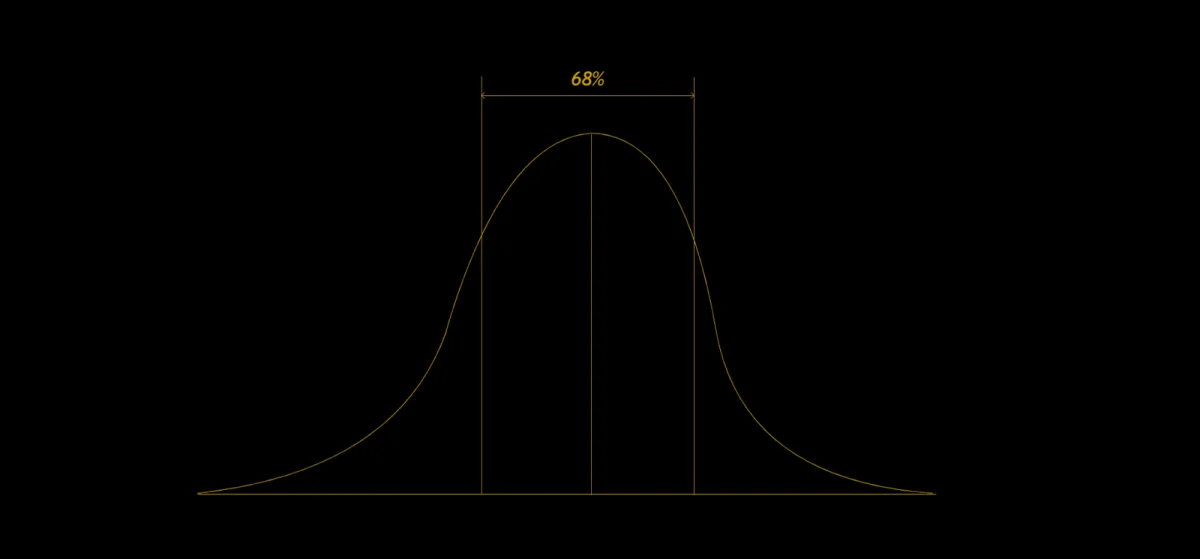
According to Auction Market Theory, we treat 68% of the distribution as the Value Area, abbreviated below as VA.
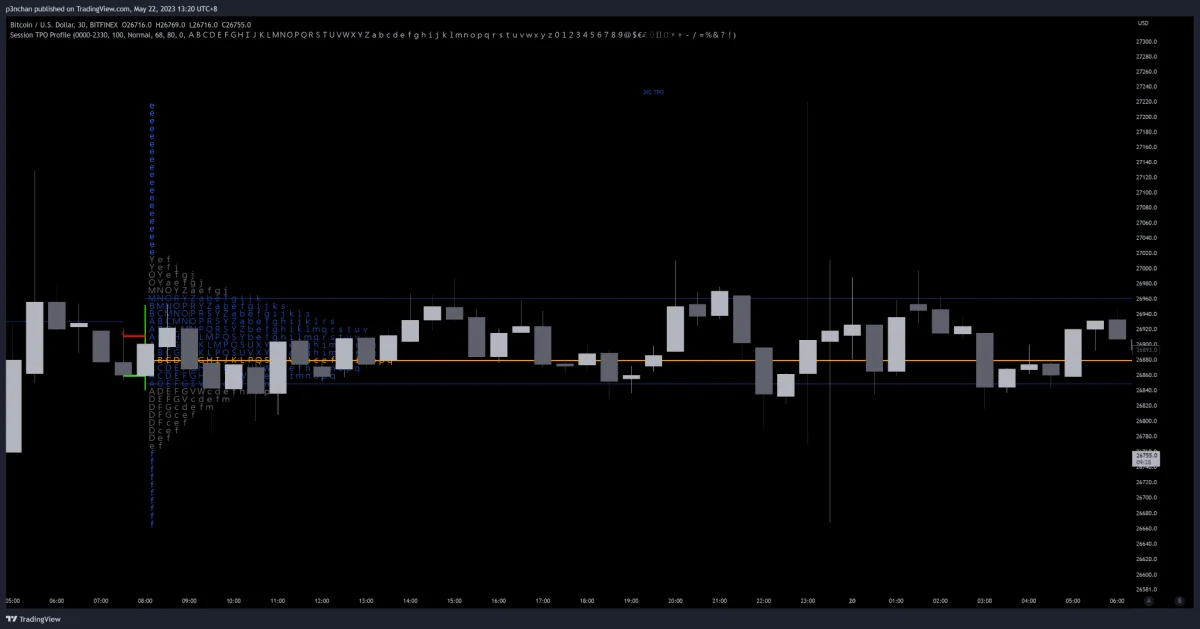
In the middle 68% area of TPO, we mark it as a range and use it as VA. VA High and VA Low represent the high and low of that range, respectively, shown as the blue zone in the middle of the chart above. Price action inside this range can be judged with help from Auction Market Theory parts 2 and 3.
Because TPO has a lot of content, we will only cover the most basic concepts here. Next time, we will break down the details of TPO more carefully. For TPO indicators, Penchan mentioned some useful TradingView indicators in a past post for reference: https://www.instagram.com/p/ClBAQBqpElT/ .