
This article is only a personal trading study note and does not constitute investment advice. Trading involves risk. Make independent judgments and take responsibility for your own decisions.
ICT Market Structure concepts: short-, intermediate-, and long-term highs and lows.
Penchan has recently been reading ICT, Inner Circle Trader, content. These ideas are the original concepts behind SMC, Smart Money Concepts. Depending on the situation, I will share useful pieces with everyone.
In past weekly reports, we mentioned that Market Structure can be built from the most basic units: swing high / low. Among these basic units, if we can arrange and combine them, we can obtain higher-level swing high / low structures. From there, we can judge the state of Market Structure. Below, we use highs as the example. Lows are judged the same way.
Short-Term High / STH (Short-Term Low / STL)
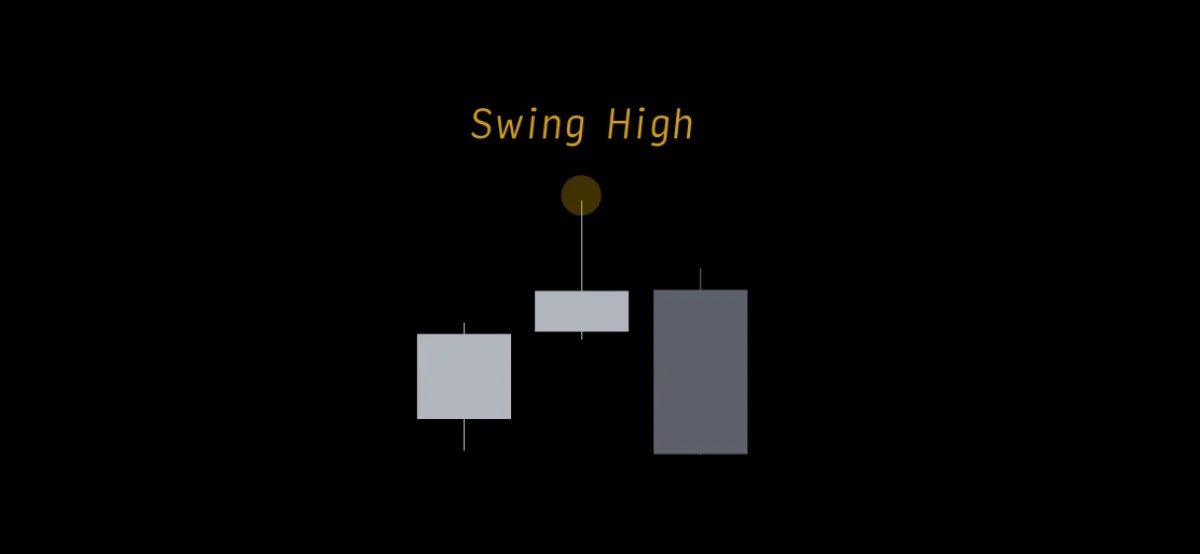
On the chart, as long as three candles appear and the middle candle is higher than the candles on both sides, we can find a swing high. At the same time, this swing high can also be an STH, short-term high.
Intermediate-Term High / ITH (Intermediate-Term Low / ITL)
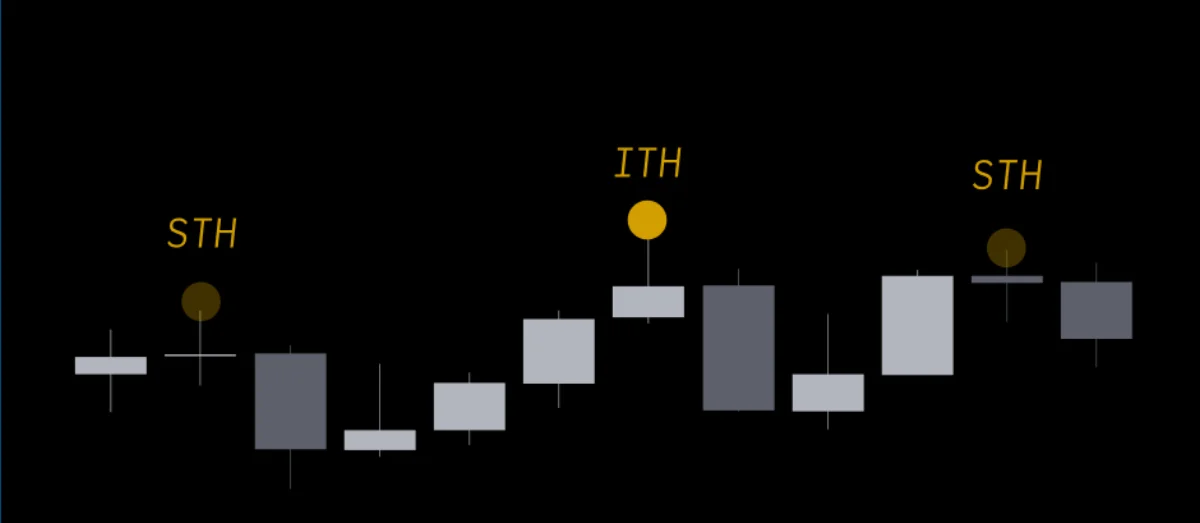
Using the same logic as above, among three STH points, if the middle STH is higher than the STH on both sides, it can become an ITH, intermediate-term high.
Long-Term High / LTH (Long-Term Low / LTL)
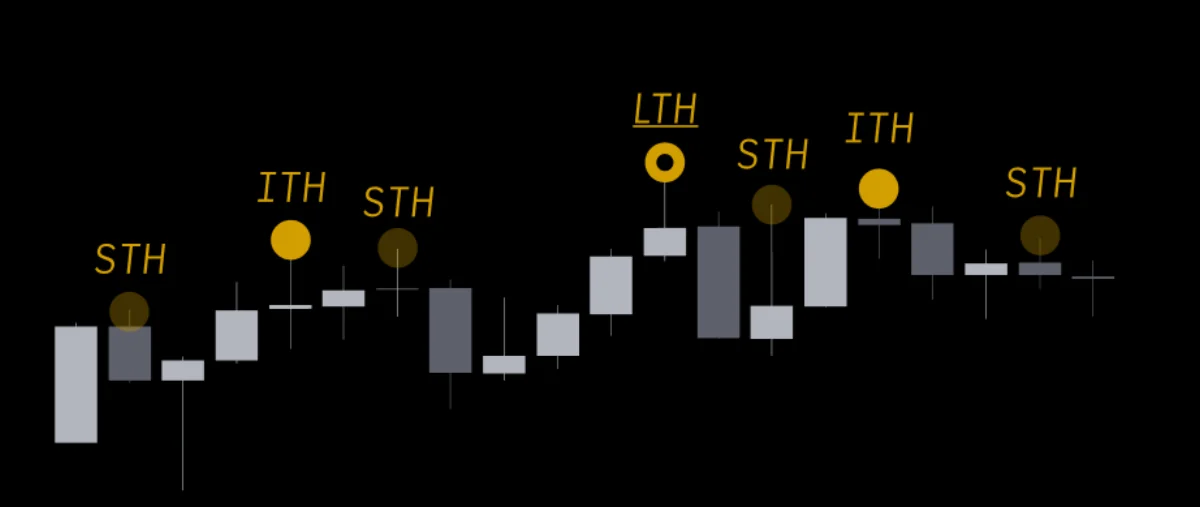
By the same reasoning, among three ITH points, if the middle ITH is higher than the ITH on both sides, it can form an LTH, long-term high.
How to Use This Market Structure Concept
OK, I suggest actually drawing it on a chart first before continuing to read.
In practice, after trying to draw it a few times, you can start to feel what counts as a more effective swing high / low. Those effective swing high / low points can then be used to judge MSB. If beginners do not know what MSB is, go back and search Penchan’s past weekly report in DA’s Telegram announcement channel: https://t.me/c/1798848331/5095?thread=4910 .
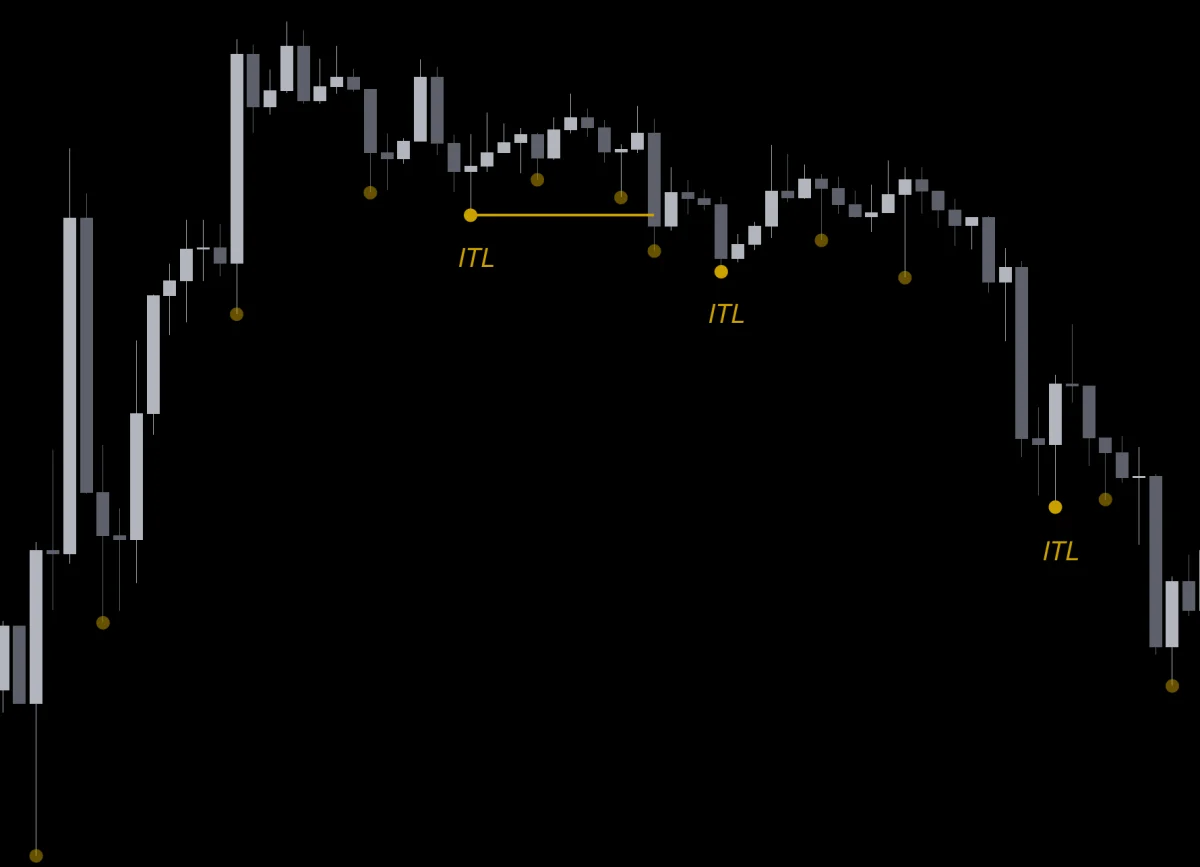
For example, here we have an ITL break. After that, we find the trend begins to reverse. At this point, we can pair it with our own technical-analysis approach to find short-entry locations. Here, I would recommend using intermediate-term ITH / ITL for observation.
Summary
LTH > ITH > STH
LTL > ITL > STL
In actual application, ICT Market Structure is not the easiest tool to use. But Penchan thinks this concept is an important learning process for reading Market Structure. Understanding intermediate-term highs and lows as a helper for judging whether the trend has changed can be very useful for beginners who feel the chart looks disorderly. If you have not drawn it yet, go draw it and see.