
This article is only a personal trading study note and does not constitute investment advice. Trading involves risk. Make independent judgments and take responsibility for your own decisions.
Deconstructing Market Structure, feat. a discussion of reversal structure.
Summary: Market Structure is made of trend and range. We can use a few deconstruction methods to read the current Market Structure and direction. By marking important points through higher high / low or lower high / low, we can express whether a period of time is in an uptrend or downtrend. These points are marked through swing high / low, then optimized so that only the necessary points remain for judgment. This article starts from basic marking, then walks everyone into reading Market Structure and its trend, and finally discusses how to read reversal structure.
- Swing High / Low marking method
We use a real example to demonstrate. As shown in Figure 1, mark a peak that is higher than both neighboring highs, or lower than both neighboring lows, to identify swing high / low.
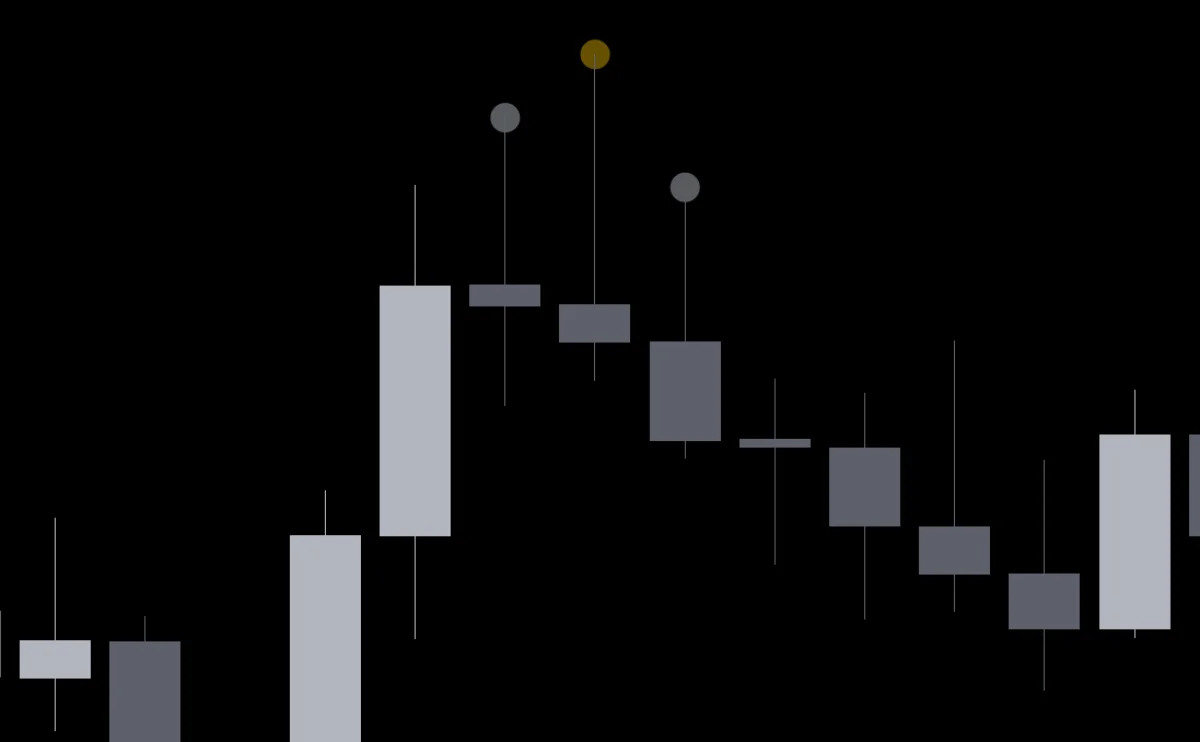
Figure 1. The gold dot is higher than neighboring highs, so it is a swing high
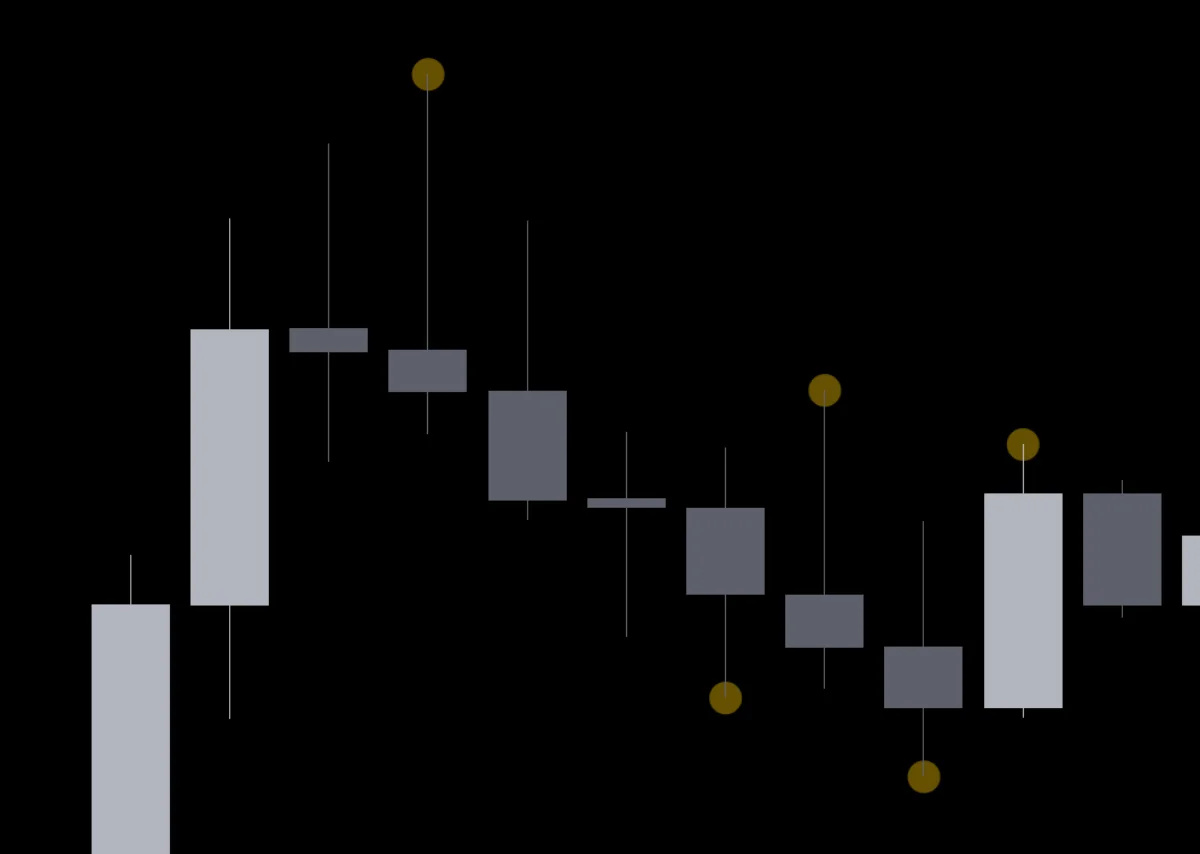
Figure 2. By the same logic, we mark the other swing highs. Swing low works the same way, except we choose lows that are lower than their neighbors
- Higher High / Low, Lower High / Low, and Trend Confirmation
To confirm a trend, we need two sets of highs and lows. As shown in Figure 3 below, a downtrend requires two sets of lower highs and lower lows before the trend can be confirmed.
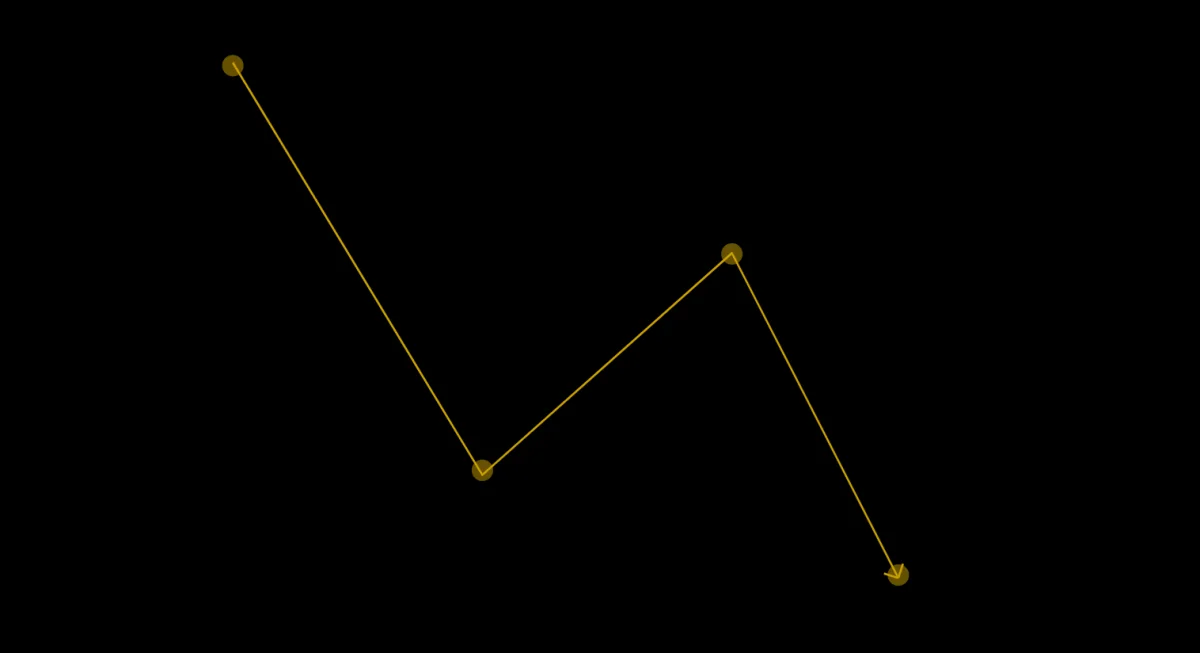
Figure 3. Downtrend structure
Returning to our example, after marking swing high / low, Figure 4 shows that we can quickly discover this section is a downtrend, meaning a trend structure formed by lower highs / lows.
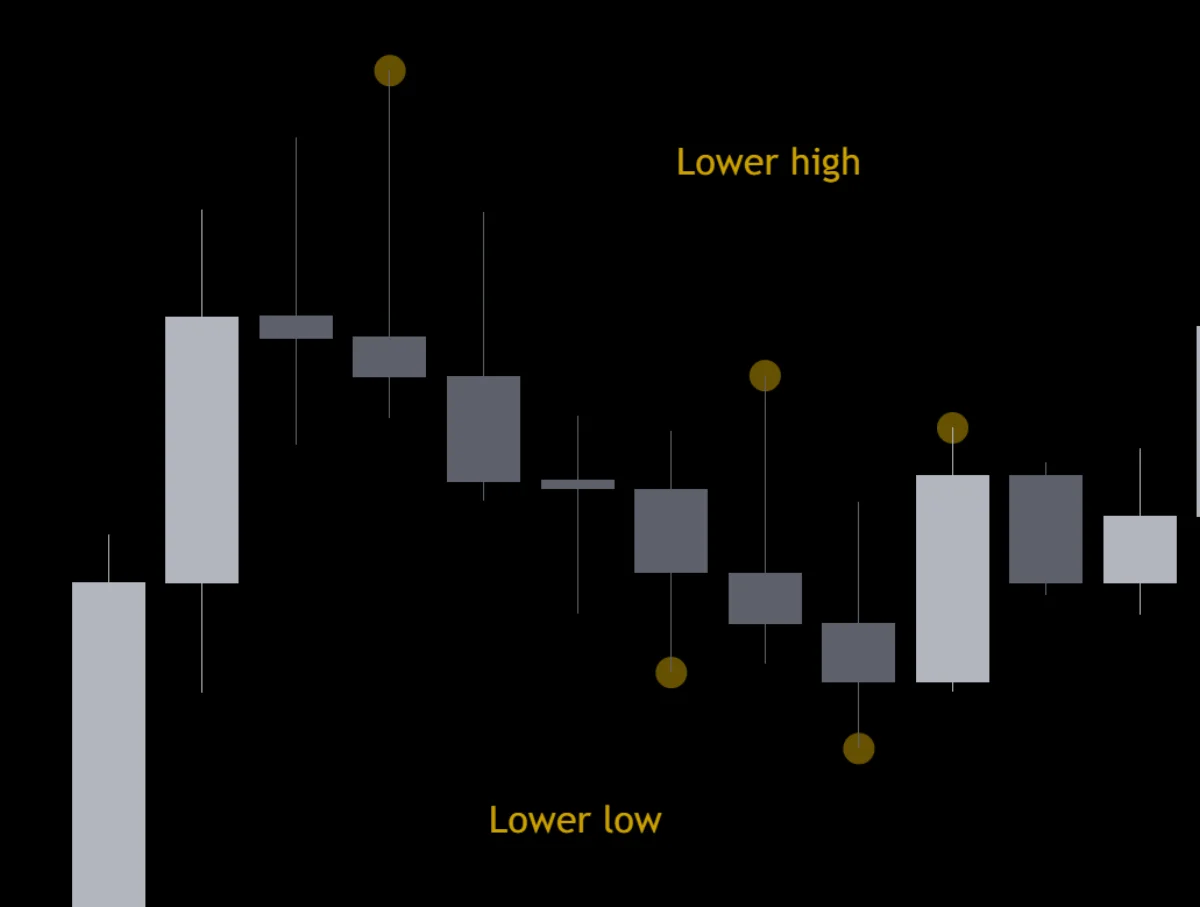
Figure 4. Lower highs / lows form, confirming the downtrend
- Reversal Structure
Here, we first mark each swing high / low with an extended line until it reaches a new swing high / low or a potential reversal.
We find that in this downtrend, the third swing high hits a candle, which is the blue box in Figure 5. Be careful: reversal structure is not confirmed yet. The top of this candle could still become a new lower high, meaning it may simply be a new high point inside the original downtrend. We can mark it first and keep observing.
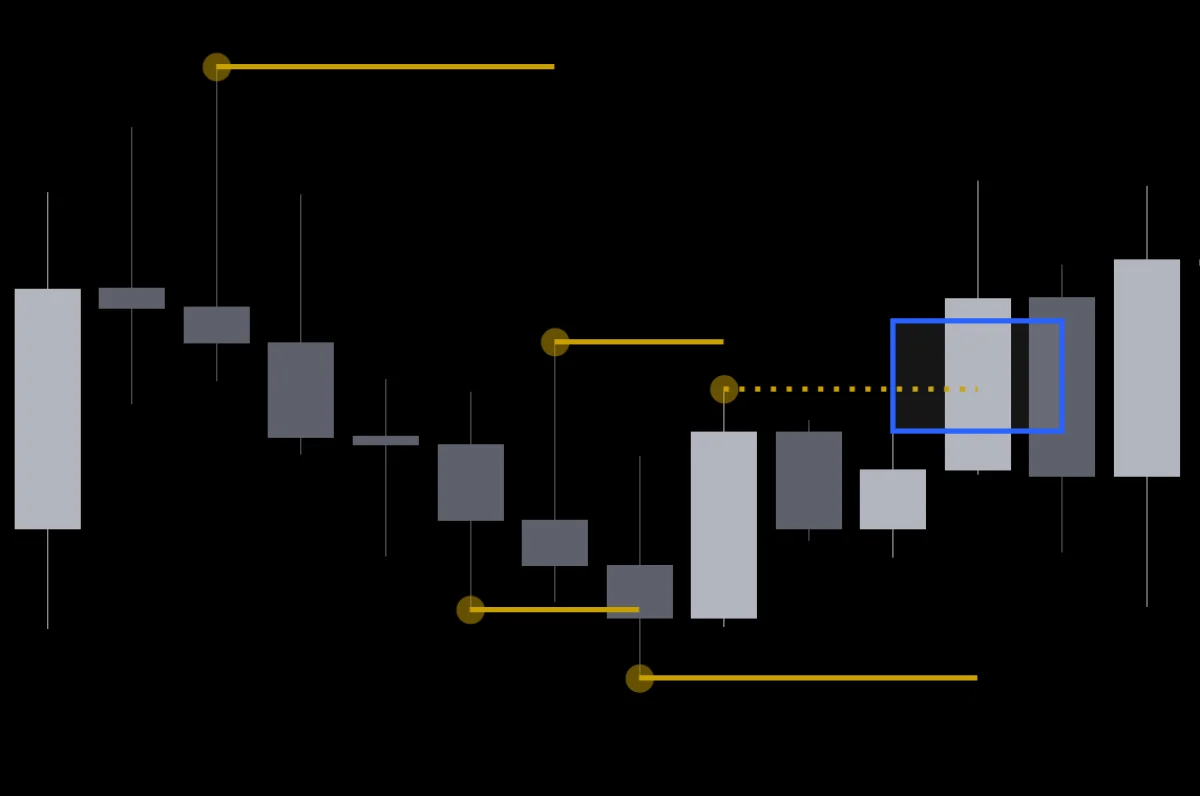
Figure 5. In a downtrend, the swing high extension line hits a candle, creating reversal potential
Look at the blue low in the lower-right corner of Figure 6. After a new higher low forms, price begins to rebound and does not fall below the original downtrend’s gold low. Later, it adds a higher high, the blue new high in the upper-right of Figure 6, and the reversal trend is confirmed.
These three blue points, together with the gold point at the very bottom, can also become two sets of higher highs / lows, which confirms an uptrend, as shown in Figure 7.
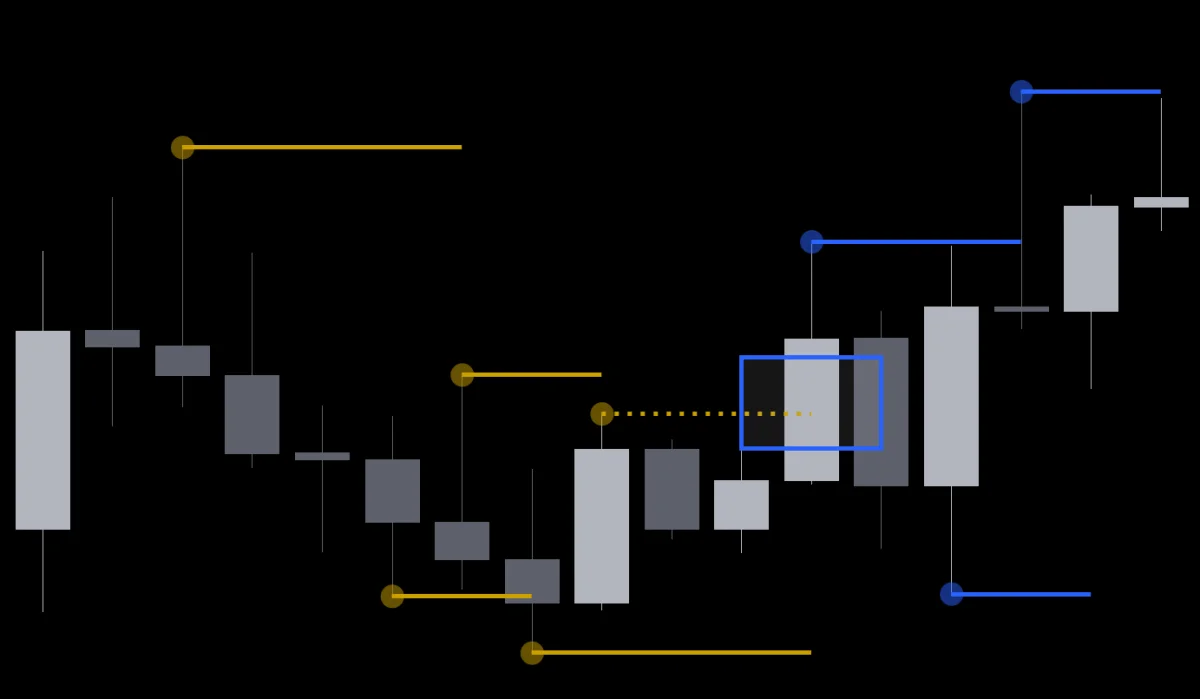
Figure 6. Later, a higher low and higher high form, confirming the reversal trend
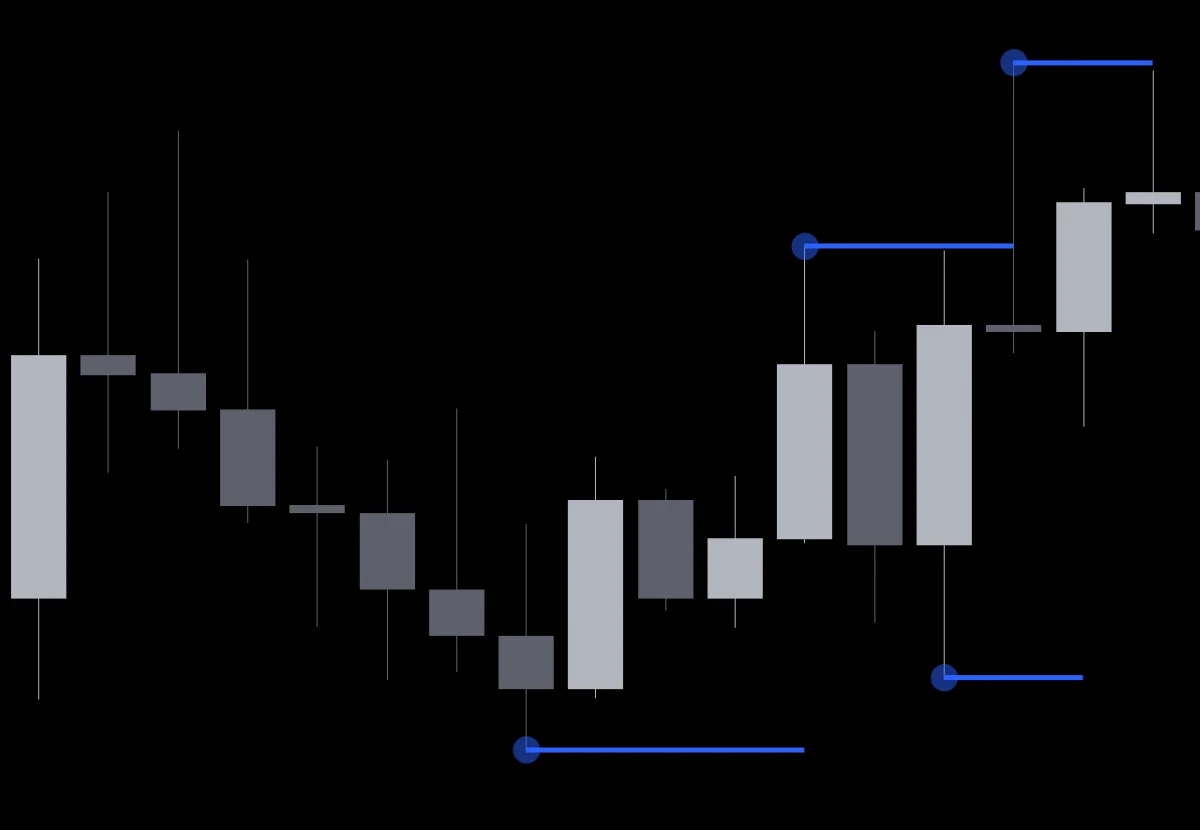
Figure 7. Two sets of higher highs / lows confirm the uptrend
Below, we use line charts to summarize the reversal-structure discussion above.
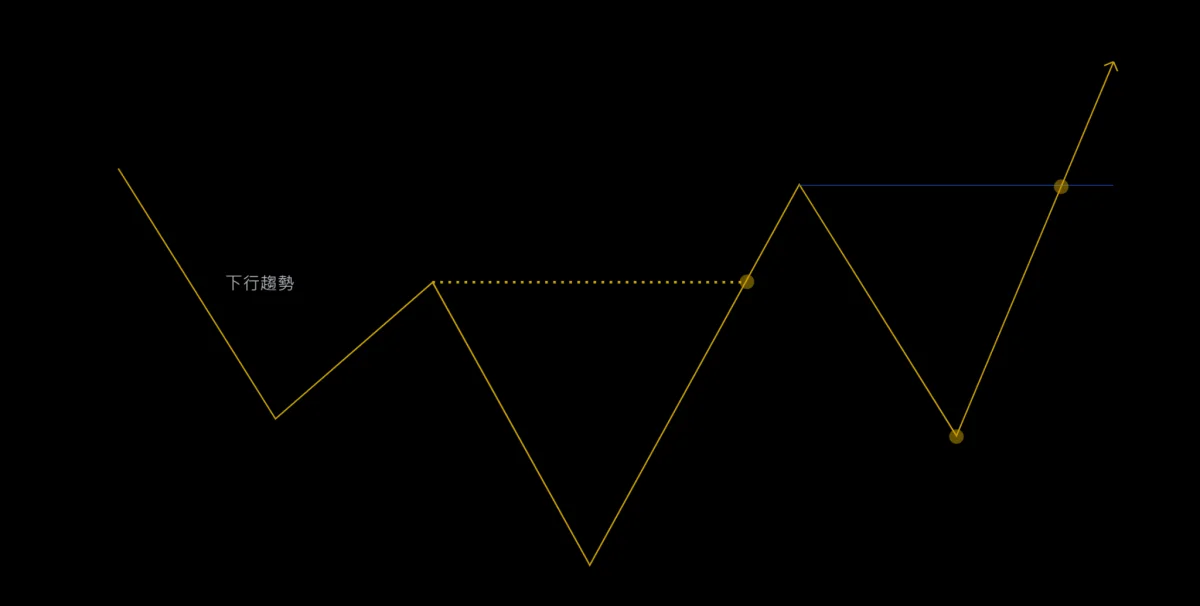
Figure 8. Reversal of a downtrend structure
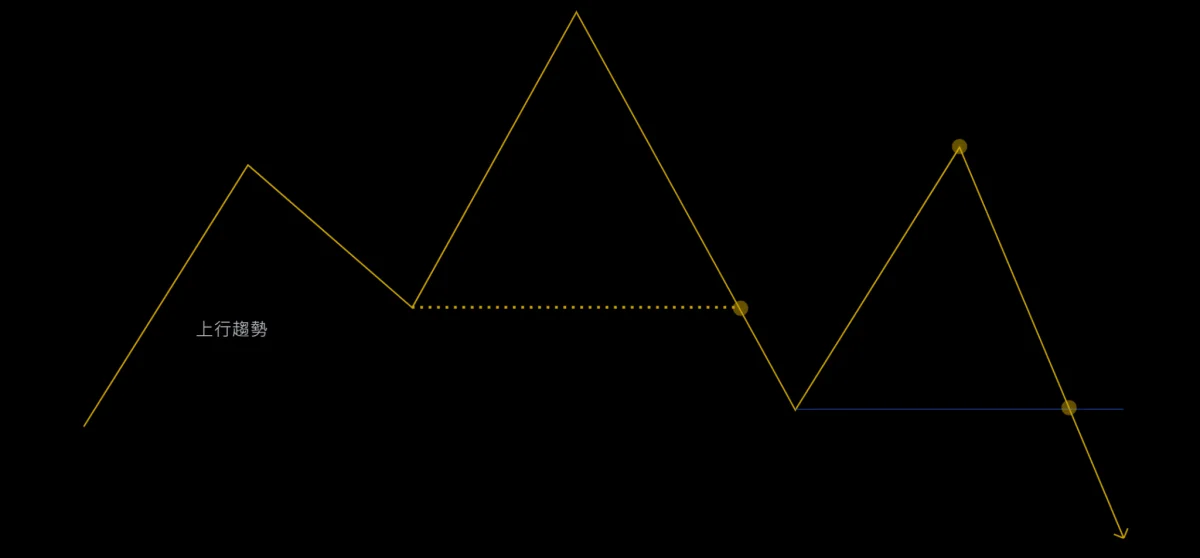
Figure 9. Reversal of an uptrend structure
If reversal structure is hard to remember, you can consider using the 123 rule as a memory aid. It is somewhat similar.
Afterword:
This article clearly defines a swing high / low marking method to help everyone deconstruct Market Structure. It is not perfect, but I believe this method can build chart feel for structure.
In real application, you will also run into other situations, such as too many points that can be marked, or points that cannot be marked. Think about how to mark better so the chart becomes easier for you to read.
This was Penchan’s first weekly report. If you have suggestions or encouragement, feel free to message me on IG @p3nchan. Thanks.