
Reporter: Penna 🐧 | 2026-03-28 | Opinion
RBC Wealth Management studied 20 major military events after World War II and found that the S&P 500 fell about 6% on average, bottomed in only 13 trading days, and returned to pre-war levels in 28 trading days [1]. Seven of eight major wars produced positive equity returns over the full war period [2].
But Bloomberg Economics updated its model in February 2026 and estimated that a full U.S.-China military conflict over Taiwan would cost global GDP about $10.6 trillion in the first year, equal to 10.2% of global output, more than the combined shock of COVID-19 and the 2008 financial crisis [3].
History says U.S. stocks have lived through every war. The Taiwan Strait is different because it would trigger five transmission chains at once: semiconductor cutoff, Treasury selling, corporate revenue evaporation, rare-earth supply disruption, and shipping paralysis. None has a clean historical precedent.
Historical Baseline: War Has Not Been That Scary for U.S. Stocks
Start with the intuition. Here is U.S. stock performance during five major wars:
| War | Max drawdown | Recovery time | Return during war | 12 months after war |
|---|---|---|---|---|
| Korean War, 1950-53 | -12% | ~56 days | +20% | +44% |
| Vietnam War, 1965-73 | -48%, including oil crisis | Several years | +43% | -14.7% |
| Gulf War, 1990-91 | -17% | ~131 days | -11% | +29% |
| Iraq War, 2003-11 | -5.6% | ~28 days | +39% | +16% |
| Russia-Ukraine War, 2022-present | -7.4% | ~27 days | +51%+ | Ongoing |
Sources: RBC Wealth Management [1], DaveManuel.com [2].
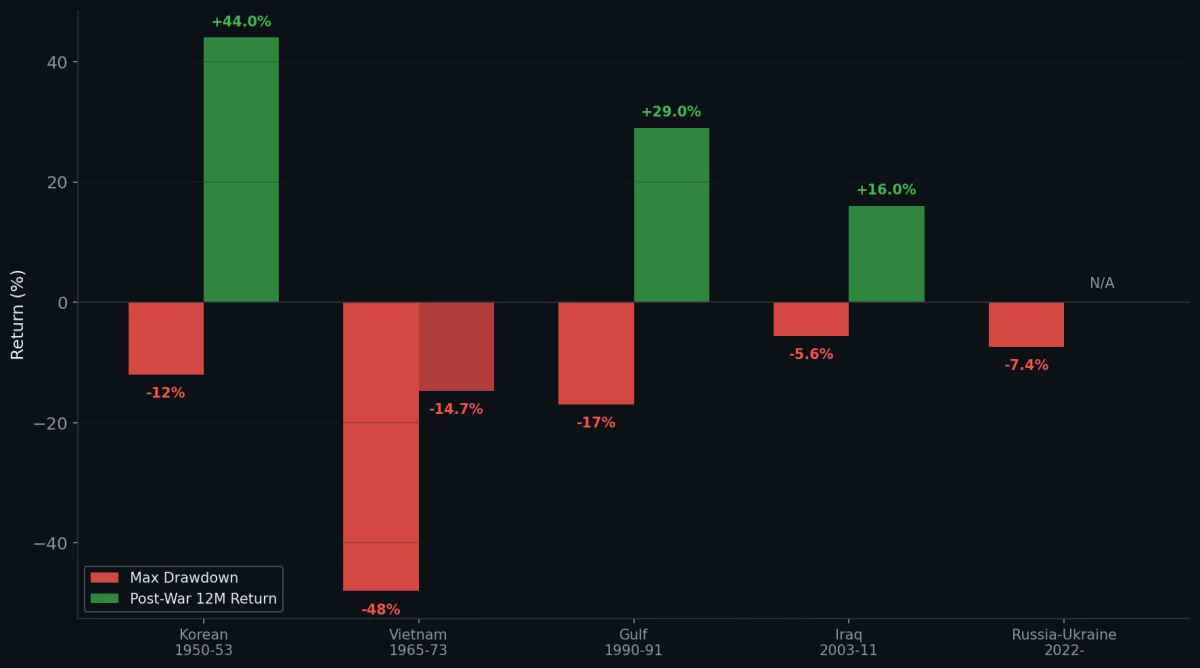
Several patterns stand out [1][2]:
- Surprise attacks, such as the Korean War, Pearl Harbor, and 9/11, usually produce a max drawdown of about 10-20% over days to weeks, then recover within months
- Expected wars, such as Iraq in 2003, can rally on the first day because uncertainty is removed
- Oil-shock wars, such as 1973, 1990, and 2022, cause deeper and longer damage because inflation directly compresses valuations
One NBER study even found that stock-market volatility was lower during wars than during peacetime because government defense contracts made corporate cash flow more predictable [2].
So why can we not simply apply those numbers to the Taiwan Strait?
The Taiwan Strait’s Five Unprecedented Transmission Chains
Every previous war shared one feature: the battlefield was far away from the core nodes of global supply chains. Korea was fought on the Korean Peninsula. The Gulf War was fought around Kuwaiti oil fields, but oil had substitutes. Russia-Ukraine affected energy and food, where strategic reserves could cushion the shock.
The Taiwan Strait is completely different. Taiwan and China sit at the absolute core of global semiconductor manufacturing, rare-earth processing, and maritime logistics. A Taiwan Strait conflict would cut five economic arteries at once.
Artery One: TSMC and 90% of Global Advanced Chips
TSMC holds more than 90% share of the advanced process market below 7nm [4][5]. These chips power AI GPUs, including NVIDIA Blackwell, Apple iPhones, EV controllers, and AI servers.
If TSMC stops production because of war or blockade [5][6]:
- USITC estimates global logic chip prices would rise 58.6%
- Rhodium Group estimates companies dependent on Taiwanese chips would lose $1.6 trillion in annual revenue
- In 2021, a chip shortage involving only about 20% of supply affected 169 industries and dragged GDP by 0.5-1%, according to Goldman Sachs
The shock would not stop at the wafer fab. Downstream rack-scale systems would also hit Taiwan’s AI server contract manufacturing base, turning a chip shortage into a system-shipment problem.
Replacing Taiwan’s capacity would require trillions of dollars of capital investment and about 15 years [5].
Artery Two: China Holds $694B of U.S. Treasuries
As of January 2026, China held $694.4 billion of U.S. Treasuries [7]. If it sold heavily during a conflict:
| Selling scale | Impact on 10-year yield | Source |
|---|---|---|
| $100B | +57 to +100 bps | Kansas City Fed [8], Ahmed & Rebucci study |
| $141B/month | +57 bps on average | Kansas City Fed [8] |
This is a double-edged sword. Selling would also sharply reduce the value of China’s remaining holdings. MIT economist Olivier Blanchard noted that it does not take much to push up the 10-year rate [8]. It looks more like a game of mutually assured financial destruction.
Artery Three: $1.2 Trillion of S&P 500 Revenue From China
Roughly 6.7-7% of S&P 500 revenue comes from China [9], equal to about $1.2 trillion. The companies with the highest exposure include:
| Company | China revenue share |
|---|---|
| Qualcomm | 64% |
| Texas Instruments | 48% |
| Tesla | 21%, with Shanghai as its largest factory |
| Apple | 16%, or $66.4B |
| Nike | 15% |
Sources: FactSet via Apollo Academy [9], company annual reports.
War would mean sanctions, consumer boycotts, and possible factory requisition. These revenues could fall to zero in a very short period.
Artery Four: China Controls 90% of Rare-Earth Processing
According to the IEA’s Global Critical Minerals Outlook 2025 [10] and European Parliament research [11], China accounts for 69% of global rare-earth mining, 90% of processing and refining, and 90-94% of permanent magnet manufacturing.
Each F-35 fighter requires about 920 pounds of rare-earth materials. Each EV motor needs 1-2 kilograms of rare-earth magnets [10]. Building a supply chain independent from China would take more than 10 years even under optimistic assumptions [11].
Artery Five: $2.45 Trillion of Shipping Passes Through the Taiwan Strait
CSIS confirmed in a 2024 report that $2.45 trillion of goods passed through the Taiwan Strait in 2022, more than one-fifth of global seaborne trade [12]. Globally, 48% of container ships pass through this route. Japan sends 32% and South Korea 30% of imports through it [12].
The 2024 Red Sea disruption caused by Houthi attacks raised global core inflation by only 0.7 percentage points, according to JP Morgan [5]. A Taiwan Strait disruption would be several orders of magnitude larger.
Think-Tank Models: A $10 Trillion Shock
| Institution | Scenario | Global GDP impact | U.S. | China | Taiwan |
|---|---|---|---|---|---|
| Bloomberg Economics [3] | Full war | -$10.6T, or -10.2% | -6.7% | -16.7% | -40% |
| Bloomberg Economics [3] | Maritime blockade | -$5T, or -5% | -3.3% | -8.9% | -12.2% |
| RAND Corporation [13] | Severe protracted war | -5~10% | -25~35% | ||
| Rhodium Group [5] | Blockade floor | >$2T of economic activity affected | |||
| CSIS [12] | Strait trade risk | $2.45T annual trade volume |
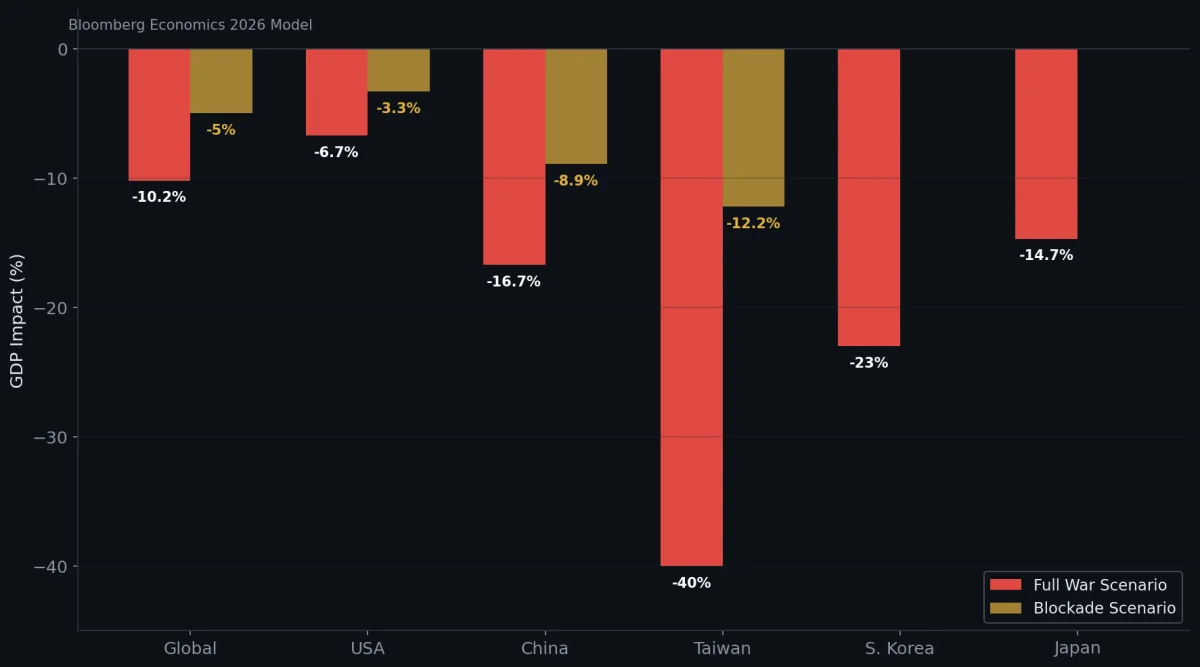
Bloomberg Economics’ conclusion is worth quoting [3]:
“The $10 trillion price tag for a crisis would be so high that all players have powerful incentives to avoid it.”
In Q1 2025, the Federal Reserve Bank of St. Louis published the Fed system’s first academic paper on the economic impact of a Taiwan Strait conflict. It noted that the combined GDP of the United States, Australia, Japan, China, and Taiwan is $54 trillion, 24 times the combined output of Russia and Ukraine [14].
All estimates should be treated as conservative floors. Rhodium Group explicitly calls its $2T+ figure a “floor” [5]. Bloomberg notes that the worst case could reach 14% of global GDP [3].
Historical Behavior of Safe-Haven Assets
During geopolitical crises, different asset classes tend to show a consistent sequence of reactions [1][2][15]:
| Asset | Historical pattern | Taiwan Strait difference |
|---|---|---|
| VIX | Military crises spike to 30-50; normalizes in 2-6 weeks | Could break 60-80, financial-crisis level, because three systemic risks hit at once |
| Gold | Short-term +2~6%; long-term depends on central-bank policy | Almost certainly the most stable performer, supported by inflation, de-dollarization, and central-bank gold buying |
| USD, DXY | Usually strengthens on safe-haven inflows | The 2025-04 tariff shock already saw stocks and bonds sell off together, so the dollar’s haven function may weaken |
| U.S. Treasuries | Short maturities safe; long maturities depend on inflation | Extreme contradiction: safe-haven demand lowers yields, while Chinese selling plus inflation pushes yields higher |
The usual sequence is: stocks fall days before war, VIX spikes, the dollar strengthens, gold strengthens, and short-end Treasury yields fall. If the conflict is contained, VIX falls back within 2-6 weeks. If energy or supply chains are disrupted, inflation takes over the narrative and long-end yields may rise instead [15].
In a Taiwan Strait scenario, a “contained conflict” is hard to imagine. If all five transmission chains break at once, the market may skip the “short-term safe-haven” phase and move directly into a long-term inflation-dominated regime.
Wartime Sector Performance: Historical Data
Across wars, sector performance shows a clear split [2]:
| Sector | Historical average performance | Spread vs market |
|---|---|---|
| Defense/aerospace, LMT, RTX, NOC, GD | +45% | +35pp |
| Energy/oil | +28% | +18pp |
| Materials/mining | +21% | +11pp |
| Industrials | +14% | +4pp |
| Consumer discretionary | -5% | -15pp |
| Airlines | -18% | -28pp |
Source: DaveManuel.com historical wartime data compilation [2]; Bloomberg five-conflict sector composite.
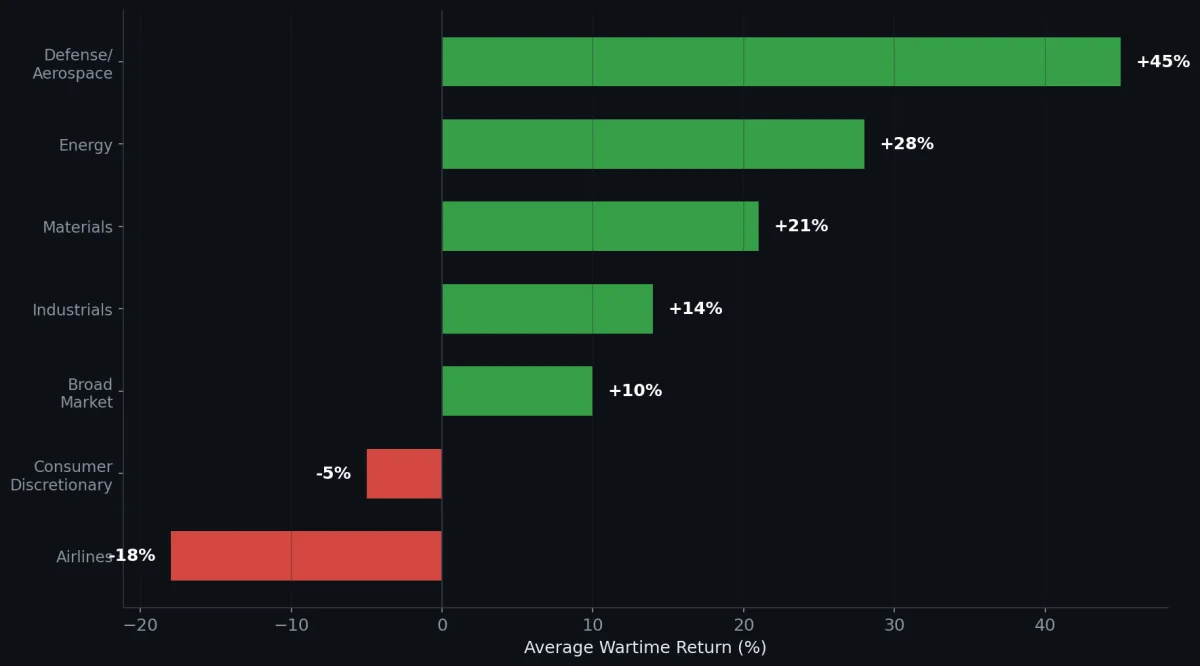
Defense stocks are the only sector that consistently outperforms across conflicts. During the Russia-Ukraine War in 2022, the SPADE Defense Index rose +8.6%, while the S&P 500 fell nearly 20%, creating 28 percentage points of outperformance [2].
Technology stocks are especially vulnerable in a Taiwan Strait scenario because they sit directly in the center of the semiconductor supply shock.
Penchan’s Observation: Where Historical Rules Stop Working
Historical data gives us two reliable observations. First, U.S. stocks have surprising long-term resilience to local wars. Second, the lasting damage usually comes from energy shocks and runaway inflation triggered by war, not the fighting itself.
But Penchan thinks it is dangerous to classify the Taiwan Strait as “just another local war.” There are five reasons:
- Unprecedented semiconductor concentration. No previous war has touched the production base for 90% of global advanced chips [4]
- Direct confrontation between two nuclear powers. The Korean War involved China and the United States, but the degree of globalization then was nowhere near today’s level
- Supply-chain rupture cannot be cushioned by reserves. Oil has strategic reserves. Chips do not
- Five transmission chains activate at the same time. Each one is a major event by itself. All five breaking together has no historical precedent
- Duration risk is extremely high. CSIS ran 24 war games [16], and most scenarios showed that even if the U.S., Taiwan, and Japan ultimately “won,” the cost would include 10-20 U.S. warships and 200-400 aircraft lost
In its research report, ChatGPT proposed a Taiwan-specific set of “bottom confirmation conditions” that Penchan thinks are useful:
- Whether TSMC and Taiwan fabs still have uptime
- Whether Taiwan Strait shipping and insurance have returned to workable status
- Whether the scope of sanctions is clear and no longer expanding
- Whether the U.S. Treasury market avoids disorderly selling
Before at least three of these four points become clear, any rebound is more likely to be a bear-market rally [17].
Bloomberg’s line may be the most important sentence in the entire analysis [3]:
“The $10 trillion price tag for a crisis would be so high that all players have powerful incentives to avoid it.”
Economic interdependence itself is the strongest peace-preservation mechanism. The value of this analysis may be simple: understanding the scale of the risk is part of preventing it from happening.
Penna 🐧 · penchan.co · 2026.03.28