
This article is only a personal trading study note and does not constitute investment advice. Trading involves risk. Make independent judgments and take responsibility for your own decisions.
Bitcoin halving countdown: using time and price analysis to observe historical cycle patterns.
As the fourth Bitcoin halving was already entering its final one-year countdown, as of April 2023, Penchan is using a timeline to analyze the possible timing of the 2023 mini bull market high and the potential low before the halving. Through this article, I hope to provide one observation angle. Please note that this article is for reference only and is not investment advice.
First, let’s understand what Bitcoin halving is. In plain English, the Bitcoin blockchain was designed from the beginning with a halving mechanism for Bitcoin issuance. The amount of Bitcoin miners receive changes according to the current block reward. At the time, April 2023, Bitcoin miners could mine about 6.25 Bitcoin every 10 minutes. As time moves forward, Bitcoin’s unit issuance becomes smaller and smaller. In total, Bitcoin will go through 32 halving processes, and each stage’s block reward will be half of the previous stage. This gives Bitcoin a deflationary characteristic and makes it fundamentally different from fiat currency.
Looking back, Bitcoin went through its third halving on May 12, 2020, then entered its third bull market in 2021. Because of that, investors in the blockchain space look forward to every Bitcoin halving.
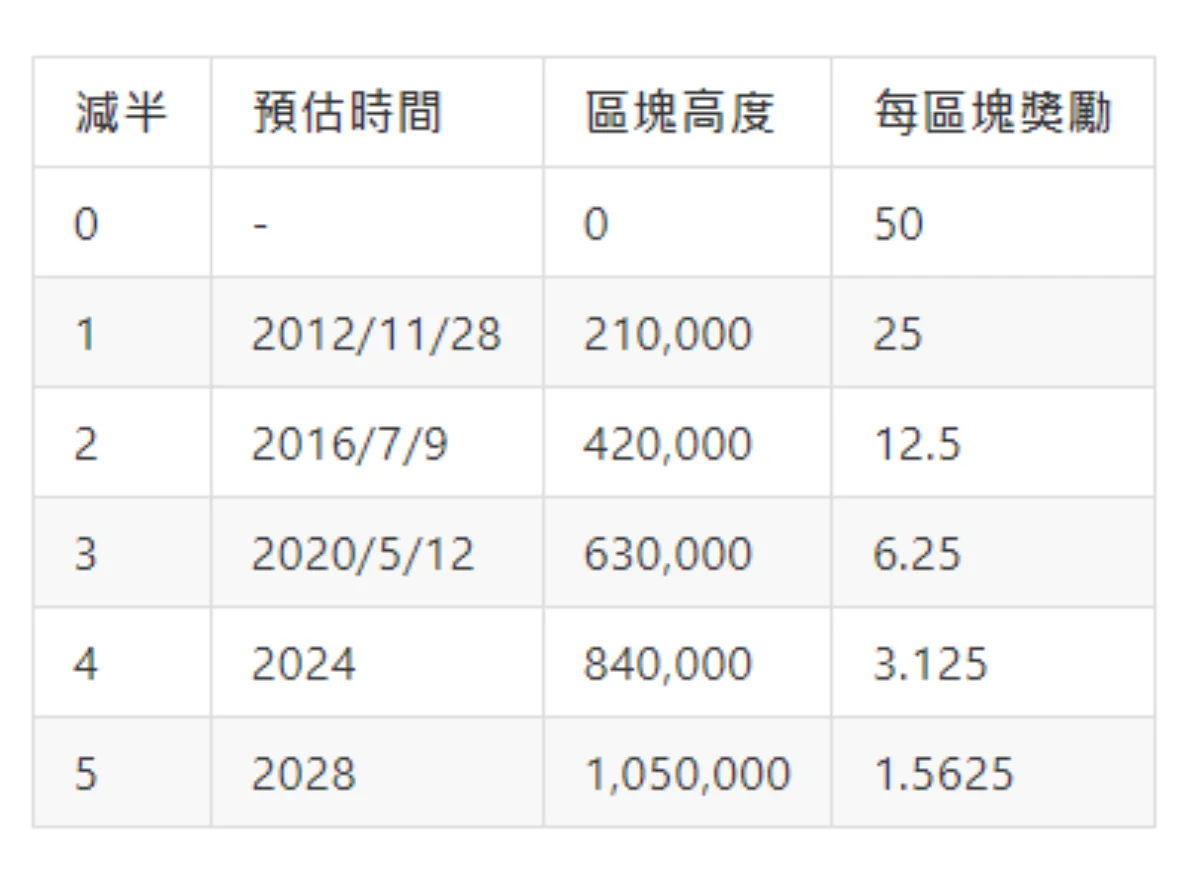
Table 1. Bitcoin halving-related information
Possible High Timing for the 2023 Mini Bull Market
Estimating From Bull Market ATH
Using the time interval between past bull market ATH, All Time High, and mini bull market highs, nATH, we can estimate that this mini bull market high may appear around June 6, 2023.
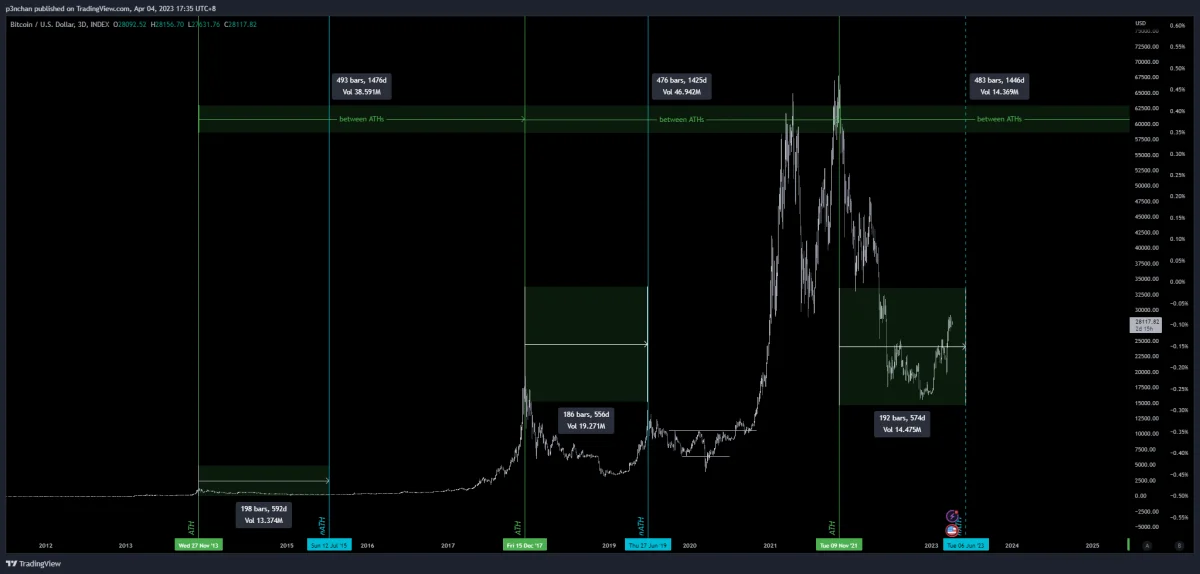
Figure 1. Time interval between bull market ATH and mini bull market nATH
Estimating Backward From the Bitcoin Halving Cycle
Since the creation of the Genesis Block on 2009/1/3, Bitcoin had gone through three halvings. Based on the average interval, the next halving time was estimated as February 17, 2024. However, because block production time differs each cycle, the more common view at the time placed it between February and June of the following year, or in April 2024. Here, we use April 15, 2024 as the assumed date of the fourth Bitcoin halving.
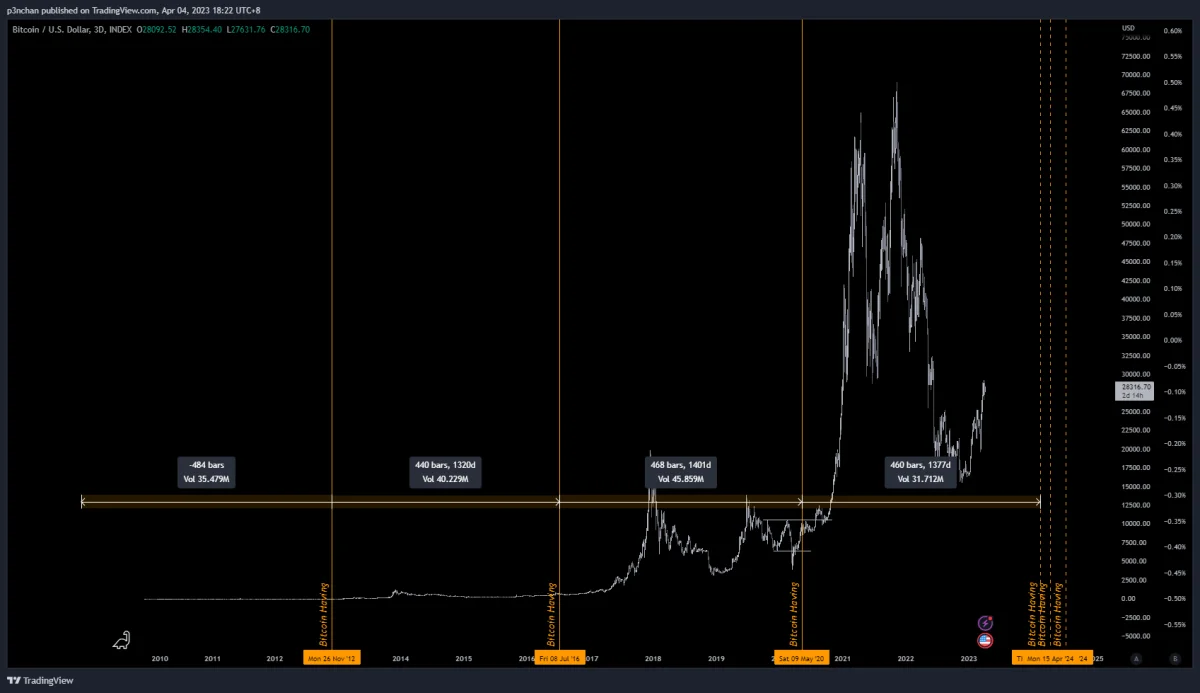
Figure 2. Bitcoin halving interval chart
If we estimate the possible mini bull market high backward from the fourth Bitcoin halving on April 15, 2024, it would be around May 11, 2023.
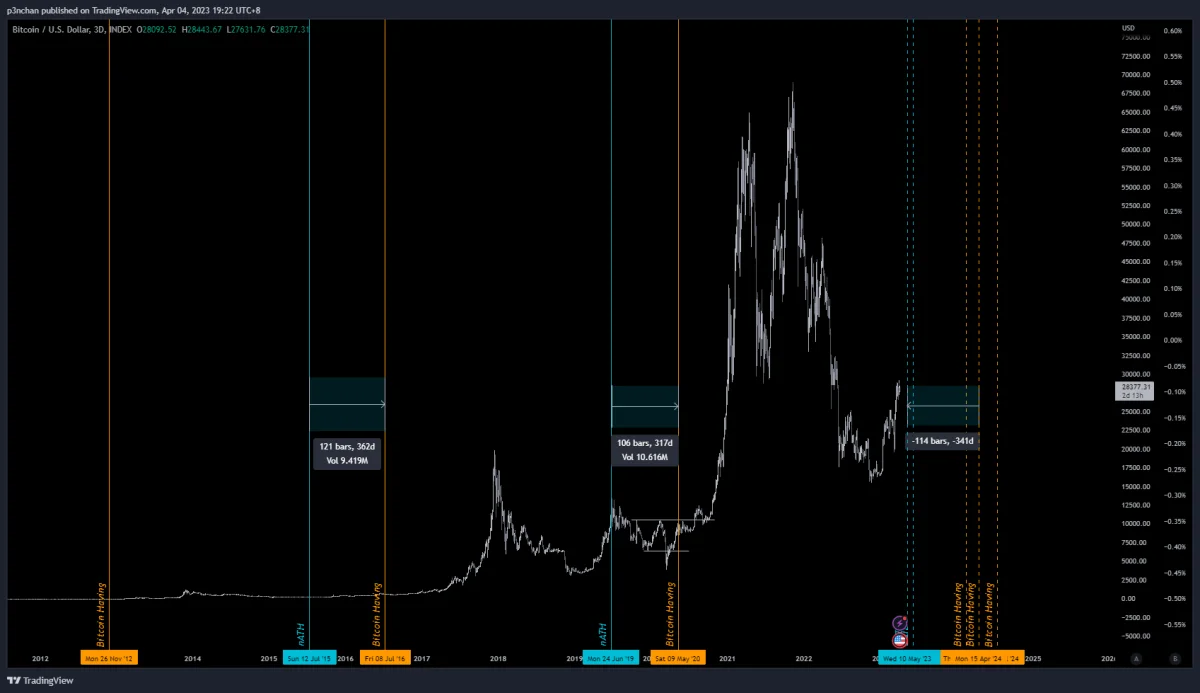
Figure 3. Bitcoin mini bull market and halving interval chart
Possible 2023 Mini Bull Market High
Combining the two methods above, if the historical pattern repeats, the high of the 2023 Bitcoin mini bull market may appear between May 11 and June 6, 2023, or near that window. However, these estimates are based on simple historical statistics. The actual market path may deviate greatly from historical patterns.
Possible Low Conditions Before the 2024 Bitcoin Halving
Based on the time from past mini bull market highs to the low before halving, we can roughly estimate this: if the 2023 mini bull market time high is the midpoint of the earlier estimate, May 25, 2023, then about 224 days later, around January 4, 2024, there may be a pre-halving low. However, because the timing of lows varies widely and the first mini bull market high is not easy to define, the January 4, 2024 estimate is not especially accurate. Do not use it as a bottom-fishing basis.
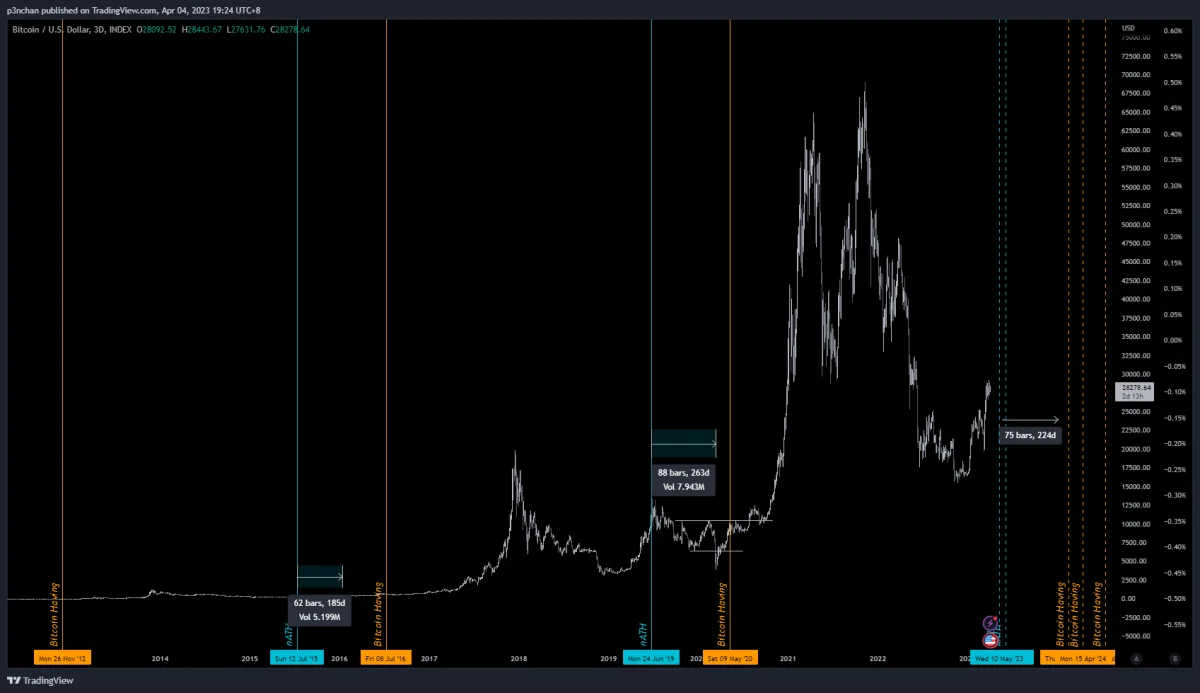
Figure 4. Bitcoin halving interval chart
Although estimating by time is difficult, we can instead observe the change in space, meaning price. Referring to past Bitcoin pre-halving declines and their Price Change, the historical 50% to 60% drawdown range has been where relative lows appeared, but this does not mean the future must repeat it.
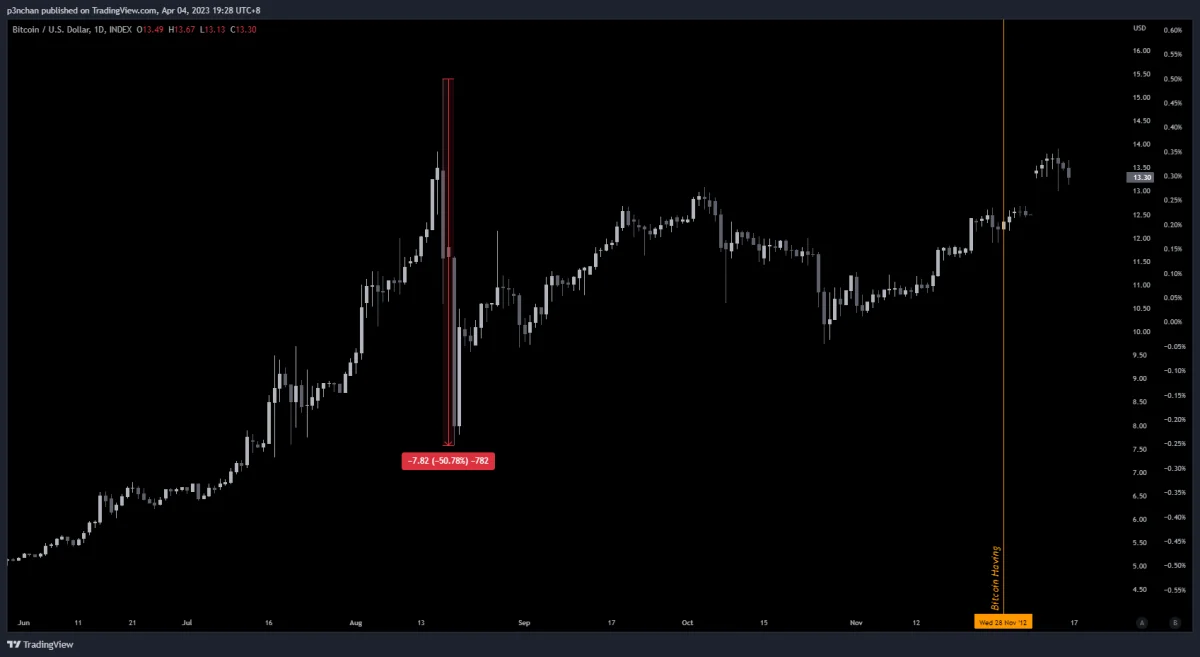
Figure 5. Bitcoin fell more than 50% before the 2012 halving
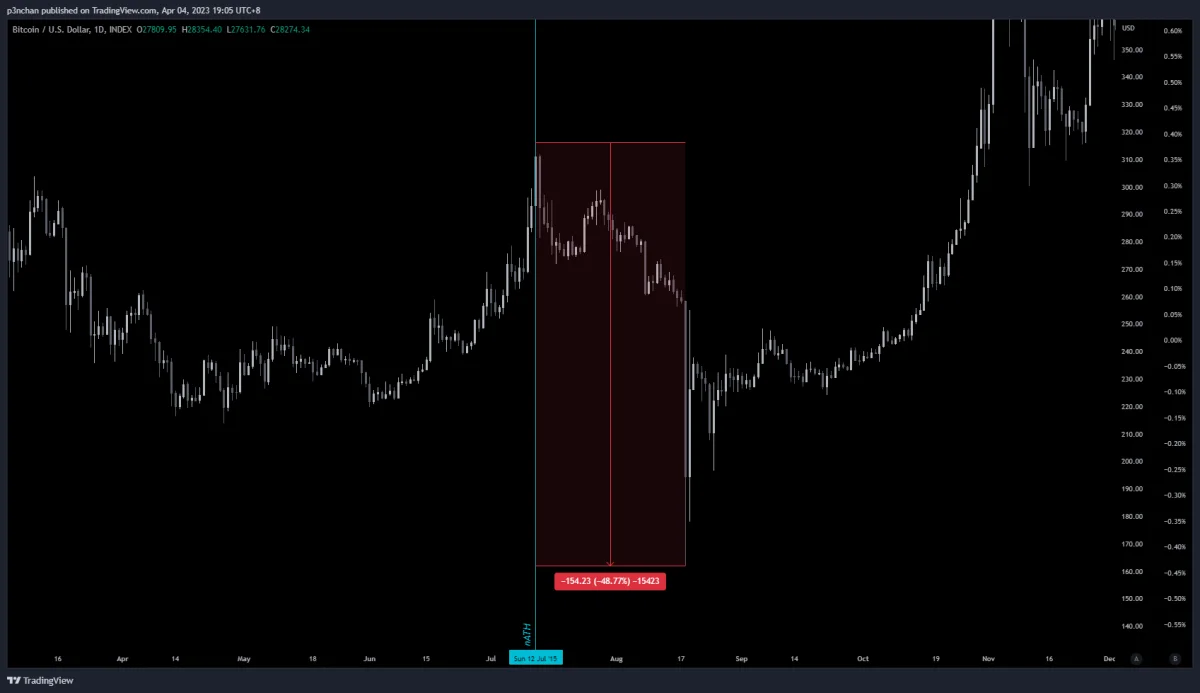
Figure 6. Bitcoin fell nearly 50% before the 2016 halving
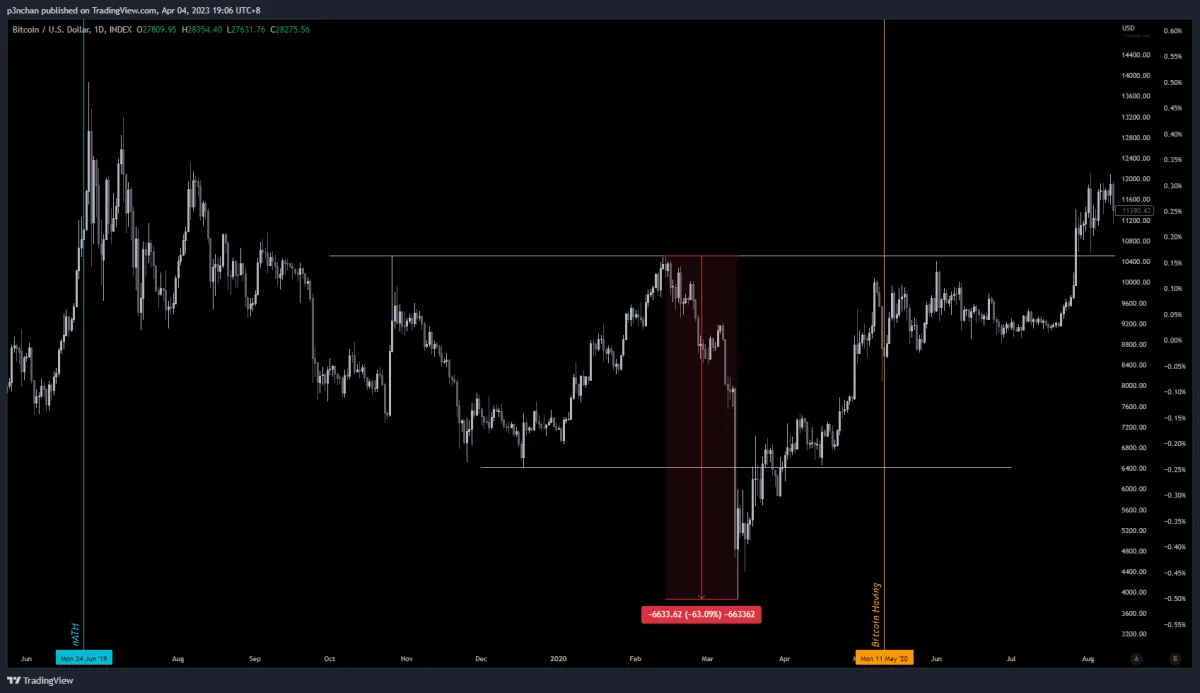
Figure 7. Bitcoin fell more than 60% before the 2020 halving
Summary of Historical Pattern Observations
In summary, if historical cycles continue to repeat, May and June 2023 may be a time window for a staged high in the mini bull market. Before the 2024 halving, if a decline close to 50% to 60% appears, then from a historical perspective it may be near a staged low. But historical statistics are not future predictions. Every halving has a different market environment and participant structure.
Please note: this article only uses past historical charts to make future estimates. For stricter analysis, on-chain data should be used to confirm whether the market environment has changed. This article is also not investment advice. Readers should take responsibility for their own buying, selling, and all other investment decisions.
Finally, I hope this article gives you some insight into Bitcoin market movement. Investment markets are full of variables, so before making investment decisions, make sure you fully understand the risks and invest according to your own risk tolerance.